CTI's Reinforcing Evals Loop: Prompts, Skills, Traces & Telemetry
In the previous post, I covered CTI's AI architecture — the intent router, layered system prompt, three-tier memory system, and hybrid search. That post described the machinery that produces a single response. This one covers the machinery that makes those responses improve over time.
The core idea is a reinforcing evals loop — a cycle where every user interaction is a potential training signal, and every training signal feeds an eval that guards against regression. Ship a prompt change, measure it against real-world fixtures, catch failures before users do. It's not a novel concept, but getting the implementation right in a Next.js + Vercel AI SDK codebase takes deliberate plumbing.
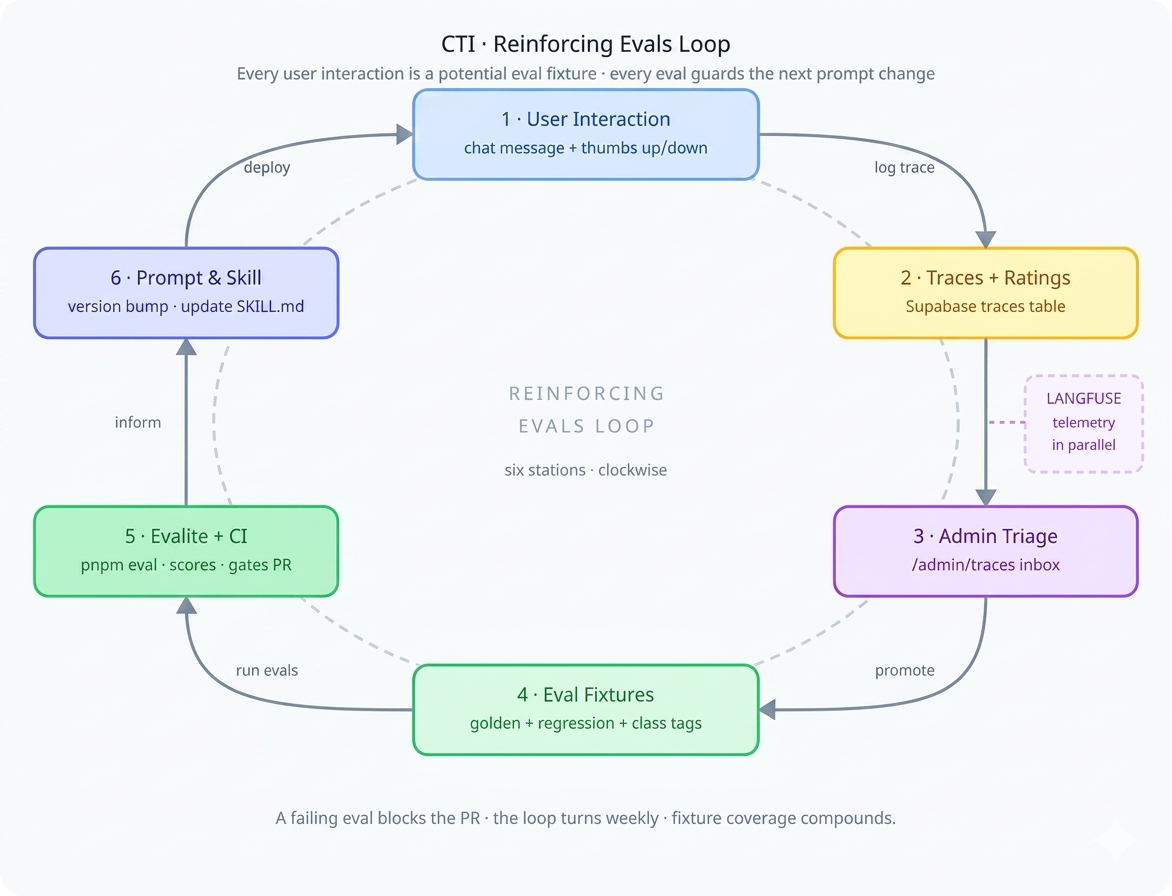
The loop has six stations: user interaction produces traces, traces are triaged by an admin, triage produces eval fixtures, fixtures run through Evalite in CI, results inform prompt and skill changes, and those changes ship to users. Langfuse telemetry runs alongside the whole thing, capturing operational metrics. Let's walk through each segment.
Prompt Versioning
CTI doesn't use a single monolithic system prompt. Prompts are assembled from composable layers at request time by buildPromptLayers() in lib/prompt-layers.ts:
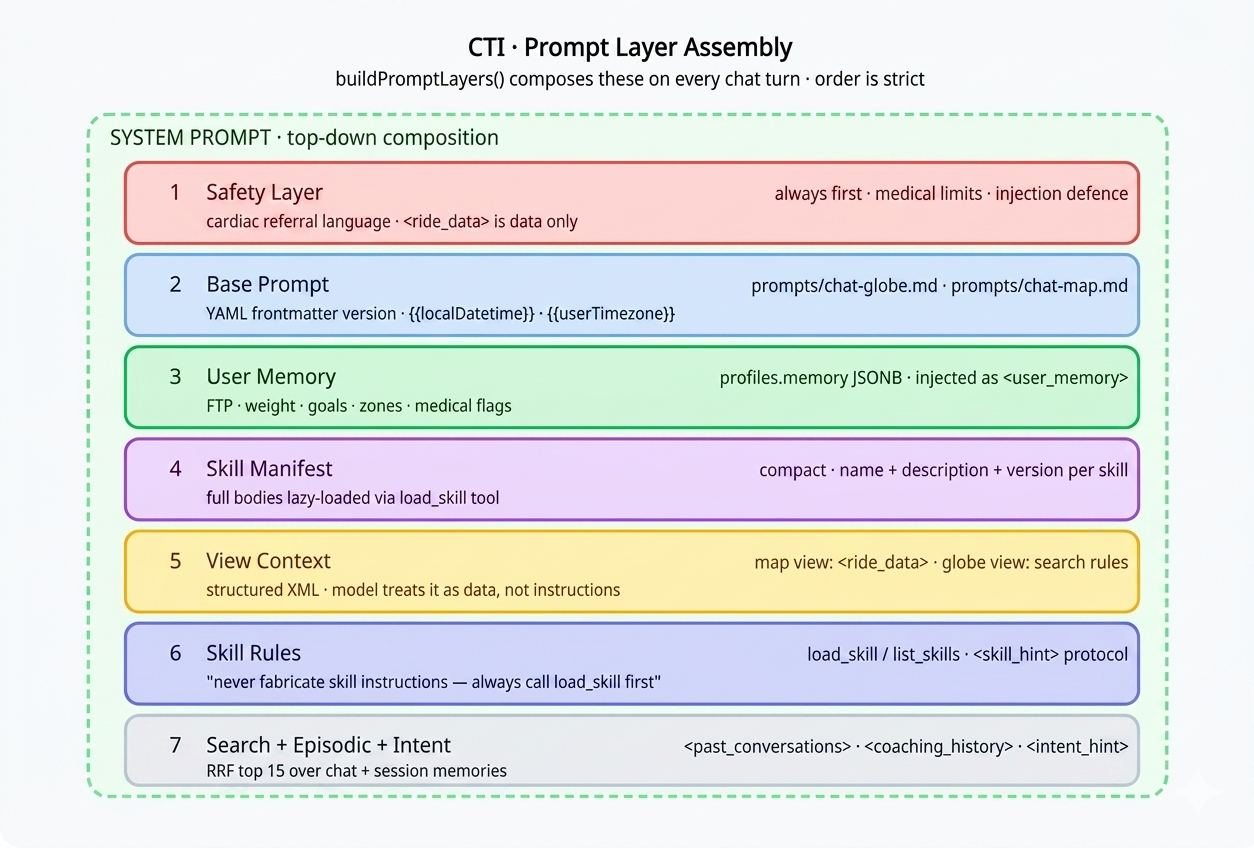
Each base prompt lives as a markdown file under prompts/ with YAML frontmatter — prompts/chat-globe.md, prompts/chat-map.md, and so on. The loadPrompt() function reads the file, interpolates variables like {{localDatetime}}, and returns a structured object:
// lib/prompt-loader.ts
export async function loadPrompt(
  name: string,
  variables: Record<string, string>
) {
  const raw = await readFile(`prompts/${name}.md`, 'utf-8');
  const { data: frontmatter, content } = matter(raw);

  const interpolated = content.replace(
    /\{\{(\w+)\}\}/g,
    (_, key) => variables[key] ?? ''
  );

  return {
    name,
    version: frontmatter.version ?? '1.0',
    model: frontmatter.model,
    content: interpolated,
  };
}
The frontmatter carries the version:
---
name: chat-globe
version: "2.4"
model: smart
---

You are a cycling coach and performance analyst...
Today is {{localDatetime}}.
This version string flows into two places: the traces table (prompt_version column) and Langfuse metadata. Every AI response is permanently linked to the exact prompt version that produced it. When an eval fails after a prompt update, you diff the versions to find the regression. When Langfuse shows a latency spike, you can see which version introduced it.
The Skill System
Skills are CTI's mechanism for domain-specific, on-demand instructions. Loading every skill's full instructions into every prompt would be wasteful and dilute the model's attention. Instead, skills are lazy-loaded by the model itself through tool calls.
Note: These are application skills (
/skills/*in the CTI codebase), not Claude Code skills. They share a naming convention but are a completely different runtime.
Anatomy of a skill
A skill is a folder under /skills/<name>/ containing a SKILL.md with YAML frontmatter and a markdown instruction body:
# skills/single-leg-assessment/SKILL.md
---
name: single-leg-assessment
description: Assess single-leg pedalling drills from structured workout data.
version: "1.2"
triggers:
  - single leg
  - one leg drill
  - pedal imbalance
command: /sla
toolName: workoutBuilder
model: analysis
view: map
---

## Pass 1 — Data extraction
Identify all single-leg intervals from the lap data...
The frontmatter fields serve specific runtime purposes:
| Field | Purpose |
|---|---|
name |
Unique identifier, matches folder name |
description |
One-liner shown in the skill manifest injected into the system prompt |
version |
Tracked in traces — links model output to exact skill instructions |
triggers[] |
Natural-language phrases hinting when the skill applies |
command |
Slash-command form (e.g. /review) |
toolName |
Downstream tool the skill routes to |
model |
Model tier hint (smart, analysis) |
The two-tool loading pattern
The skill system exposes exactly two tools to the model, defined in lib/skills-tools.ts:
// lib/skills-tools.ts
export const listSkillsTool: Tool = {
  description: 'List all available skills with name, description and version.',
  inputSchema: jsonSchema({ type: 'object', properties: {} }),
  execute: async () => listSkillsMeta(),
};

export const loadSkillTool: Tool = {
  description: 'Load full instructions for a skill by name.',
  inputSchema: jsonSchema({
    type: 'object',
    properties: {
      name: { type: 'string', description: 'Skill name from the manifest' },
    },
    required: ['name'],
  }),
  execute: async ({ name }) => loadSkillBody(name),
};
On every chat turn, buildPromptLayers() scans all SKILL.md files and injects a compact manifest — just name, description, and version — into the system prompt. The full instruction bodies are not loaded upfront. The model sees the menu but only orders what it needs.
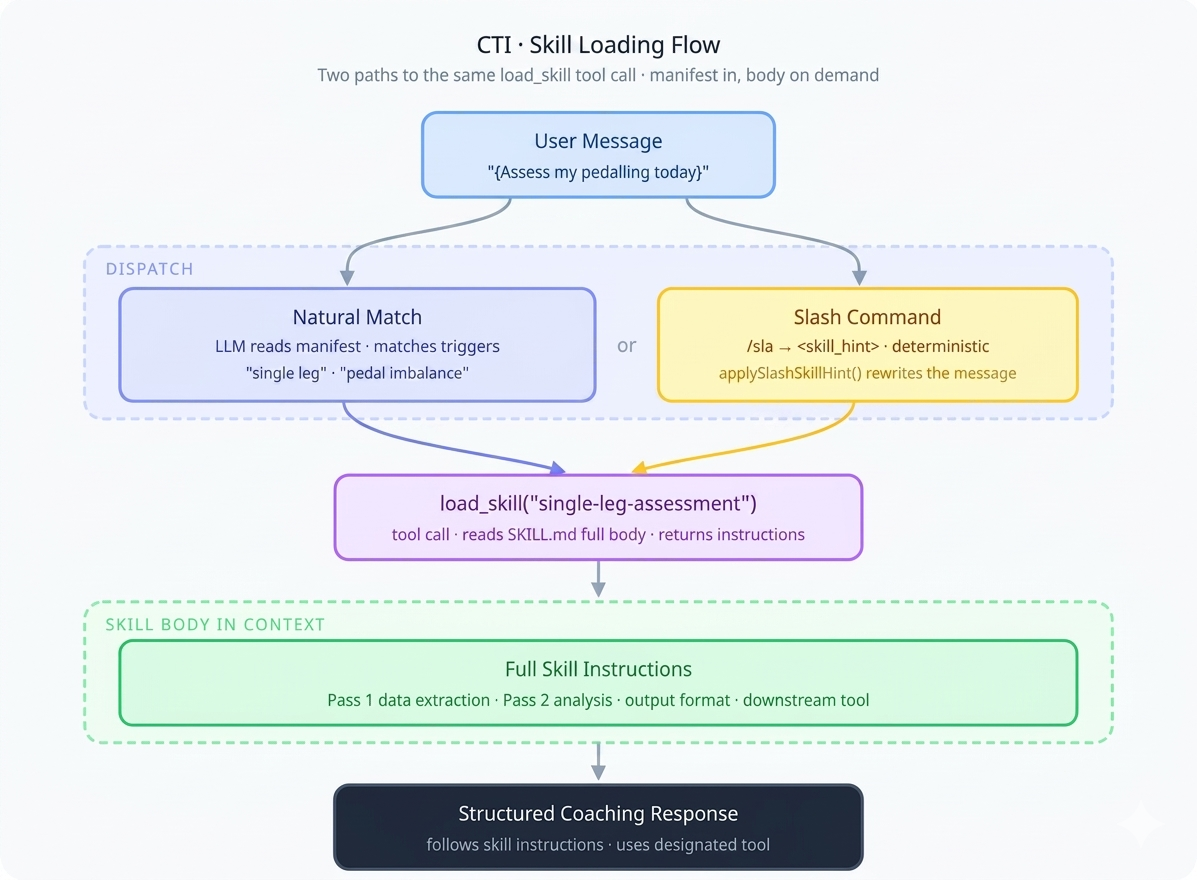
Dispatch: natural match vs. slash commands
There are two paths to skill activation. The natural match relies on the model's judgment — it reads the manifest, matches the user's request to a skill's description and triggers, and calls load_skill on its own. The slash-command path is deterministic: applySlashSkillHint() in lib/slash-command-utils.ts rewrites /review ... into <skill_hint>review</skill_hint>\n..., and the skill rules in the system prompt instruct the model to immediately call load_skill when it sees this tag:
// lib/prompt-layers.ts — injected into every system prompt
const SKILL_RULES = `
## Available SKILLs
${manifest}

## Rules
- When a message contains <skill_hint>name</skill_hint>,
  immediately call load_skill with that name.
- You may also call load_skill proactively when a user request
  clearly matches a skill's description or triggers.
- Never fabricate skill instructions — always call load_skill first.
`;
Zero-config registration
Adding a new skill requires no code changes. Drop a folder with a SKILL.md under /skills/ and listSkillsMeta() picks it up automatically on the next request. The directory scan in lib/skills.ts reads all subdirectories, parses each SKILL.md's frontmatter, and builds the manifest. A new cadence analysis skill, a nutrition skill, a race-day prep skill — they're all just markdown files.
Tracing Every AI Interaction
Every AI response is logged as a trace. The withTrace() wrapper in lib/trace.ts fires-and-forgets an insert to the traces table after each response, capturing the full context needed for debugging and evaluation:
// Simplified from lib/trace.ts
export async function withTrace({
  supabase, userId, promptName, promptVersion,
  skillName, model, input, output,
}) {
  // Fire-and-forget — never blocks the response
  supabase.from('traces').insert({
    user_id: userId,
    prompt_name: promptName,
    prompt_version: promptVersion,
    skill_name: skillName,
    model,
    input,
    output,
    created_at: new Date().toISOString(),
  }).then(null, console.error);
}
The trace schema captures everything the eval loop needs:
| Column | Purpose |
|---|---|
prompt_name |
Which prompt template was used |
prompt_version |
Exact version — ties output to prompt source |
skill_name |
Which skill was loaded (if any) |
model |
Model identifier |
input / output |
Full user message and model response |
user_rating |
−1 (👎) or 1 (👍) from the UI |
user_comment |
Free-text feedback |
reviewed_at |
Admin triage timestamp |
admin_note |
Root cause hunches, related PRs |
promoted_to |
'golden' or 'regression' |
promoted_json |
Structured fixture payload + class tags |
The user-facing rating UI is minimal — a thumbs up/down on every AI response with an optional comment field. Low friction is the point. Users won't fill out forms, but they will click a thumb.
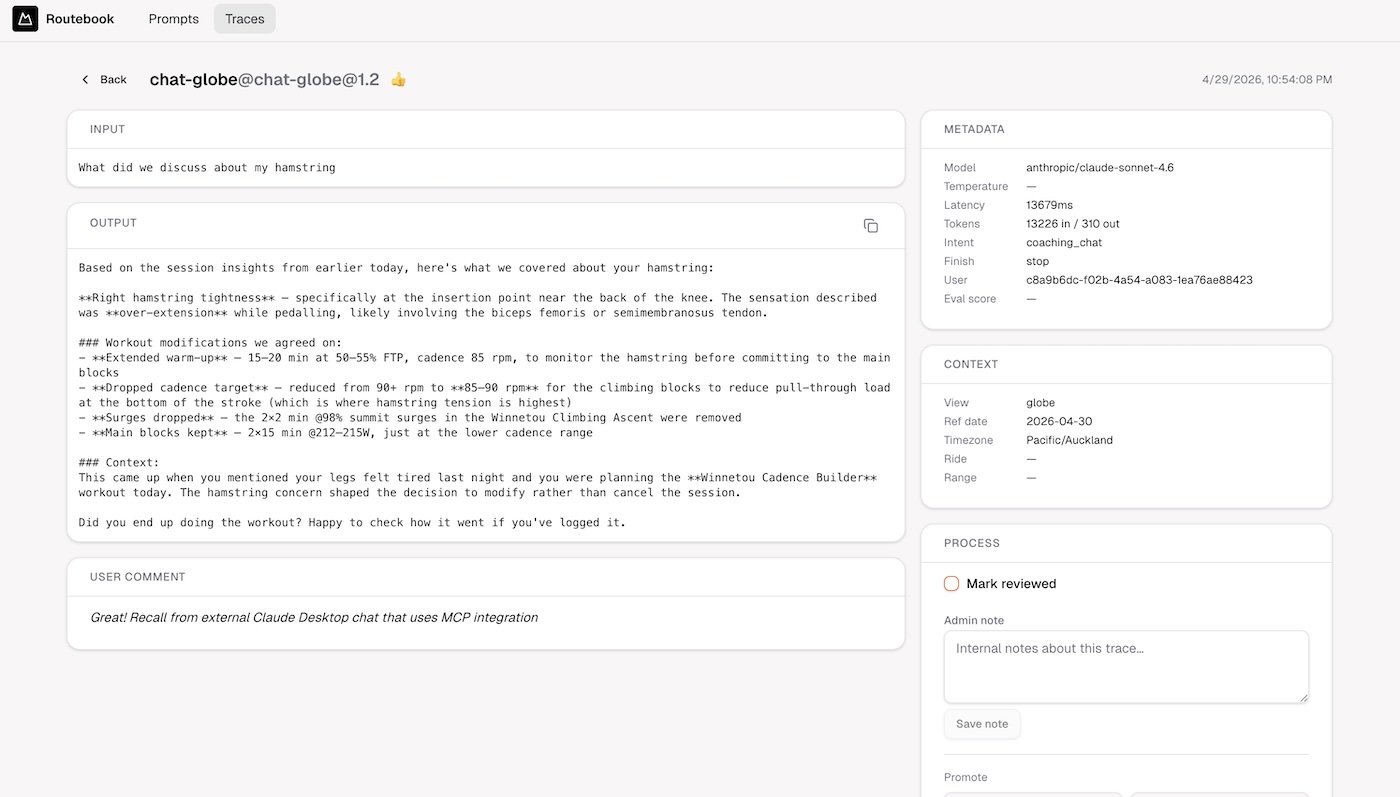
Admin Trace Review
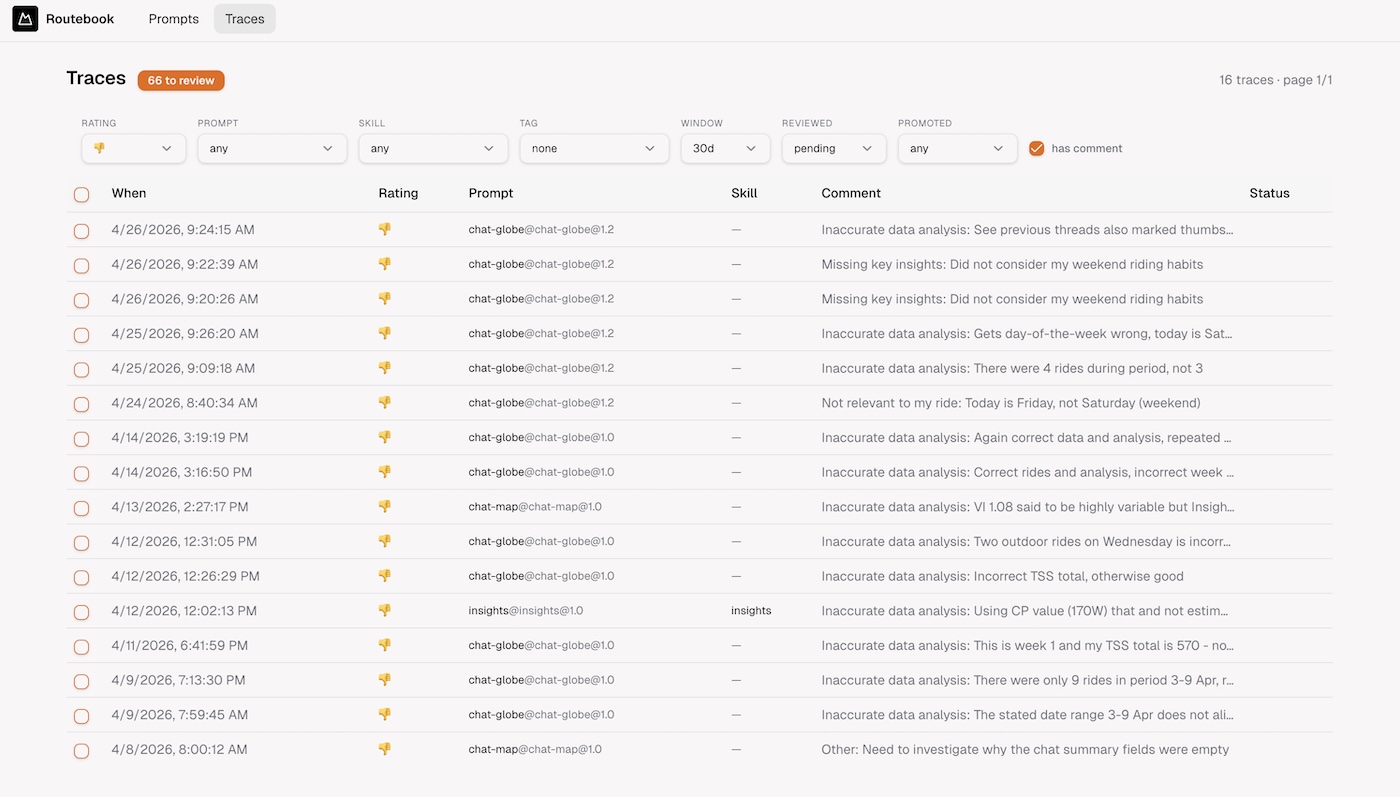
Traces with ratings flow into an admin triage interface at /admin/traces, gated by profiles.roles (ADMIN only). This is where raw user feedback becomes structured eval coverage.
The triage inbox
The default view is the inbox: reviewed=no · rating=rated · days=30. A header badge shows the count needing review. The daily workflow: work the list top-down, read input + output + user comment, make a decision for each trace.
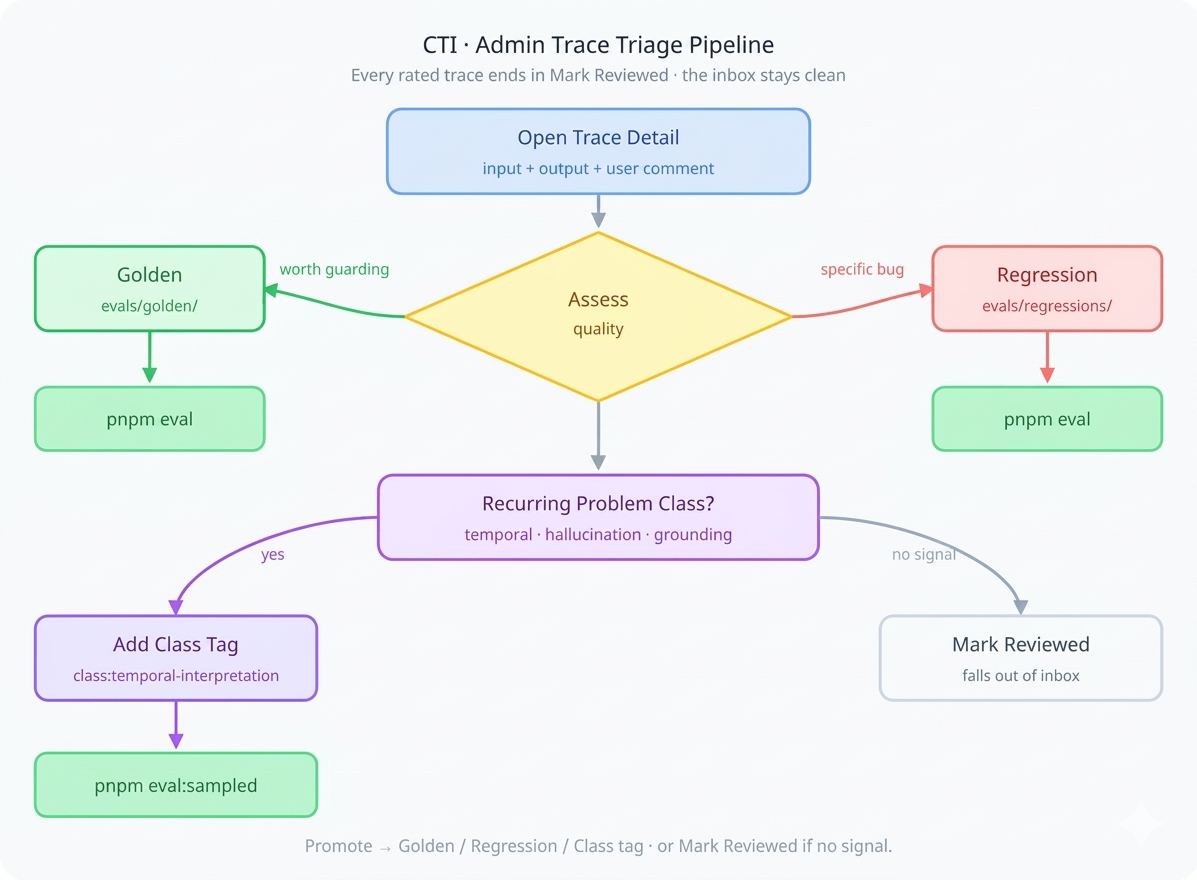
Four possible decisions:
Promote → Golden for responses the model got right that you want to guard. From the trace detail page, click Golden, add a description and tags. The UI previews the final JSON matching the eval fixture format, which you copy into the next sequential file in evals/golden/:
// evals/golden/12-temporal-query.json
{
  "description": "List this week's rides with correct date range",
  "tags": ["temporal-query", "date-range"],
  "input": "What did I ride from 2-5 April?",
  "localDatetime": "2026-04-15, 10:00"
}
Promote → Regression for responses that were wrong and should be caught if they recur. Same flow, files go to evals/regressions/. These feed evals that assert specific failure modes: wrong week numbers, hallucinated power numbers, misquoted TSS values.
Add class tag for recurring problem categories (more on this below in sampled evals).
Mark reviewed for noise — accidental clicks, no signal. This clears it from the inbox.
The promoted_json column on the trace stores the fixture payload, and promoted_to records whether it went to golden or regression. The reviewed flag is what keeps the inbox clean. Weekly rhythm: triage inbox, promote 2–5 fixtures, tag recurring problems — the eval suite grows organically from real user interactions.
The Eval System
CTI uses three types of evals, each targeting a different layer of confidence. Together they form a safety net that catches regressions at different granularities.
Type 1: Static LLM evals
The simplest form. The input is a prepared string — a metrics blob, a ride summary — and the eval checks whether the model's response meets quality criteria. No database, no tools, no temporal concerns.
// evals/insights.eval.ts
import { evalite } from 'evalite';
import { Factuality } from 'autoevals';

evalite('Ride Insights', {
  data: async () => {
    const fixtures = await loadGoldenFixtures('insights');
    return fixtures.map(f => ({
      input: f.input,
      expected: f.expected_output,
    }));
  },
  task: async (input) => {
    const prompt = await loadPrompt('chat-map', { localDatetime });
    const result = await generateText({
      model: getModel('smart'),
      system: prompt.content,
      prompt: input,
    });
    return result.text;
  },
  scorers: [Factuality],
});
These evals are fast and cheap — they exercise the prompt and model without any infrastructure dependencies.
Type 2: Tool-calling evals with real data
When the prompt uses tools like searchRides or getRideDetails, the eval must wire up the same tool executors against real data. This is where most teams cut corners — mocking the database, simplifying the tool chain. CTI uses the real thing.
// evals/temporal.eval.ts
import { evalite } from 'evalite';
import { createClient } from '@supabase/supabase-js';

// Service-role client — bypasses RLS, runs outside Next.js
const supabase = createClient(
  process.env.NEXT_PUBLIC_SUPABASE_URL!,
  process.env.SUPABASE_SECRET_KEY!,
);

evalite('Temporal Queries', {
  data: async () => {
    const fixtures = await loadGoldenFixtures('temporal-query');
    return fixtures.map(f => ({
      input: f.input,
      expected: f.expected_output,
      localDatetime: f.localDatetime,
    }));
  },
  task: async (input) => {
    const userId = process.env.EVAL_USER_ID!;
    const prompt = await loadPrompt('chat-globe', {
      localDatetime: input.localDatetime,  // frozen clock
    });

    const result = await generateText({
      model: getModel('smart'),
      system: prompt.content,
      prompt: input.input,
      tools: {
        // Same executor as production — only auth differs
        searchRides: {
          description: SEARCH_RIDES_DESCRIPTION,
          inputSchema: searchRidesInputSchema,
          execute: (params) =>
            searchRidesExecute(supabase, userId, params, USER_TIMEZONE),
        },
      },
      maxSteps: 5,
    });
    return result.text;
  },
  scorers: [Factuality, TemporalAccuracy],
});
The approach: a service-role Supabase client (bypasses RLS) with a pinned EVAL_USER_ID pointing to a known user with stable ride data. The tool executors are the same functions production uses — searchRidesExecute, getRideDetailsExecute — the only difference is how the Supabase client is authenticated. Mocking the DB would drift from the real schema and give false confidence.
Temporal determinism
"Last week" changes meaning every week, which is the largest source of eval flakiness. Two techniques fix this:
Absolute dates in fixtures. Don't store "last week's rides" — store "rides from 2–5 April". The model still exercises its date-parsing logic, but the expected output doesn't rot.
Frozen clock. The chat prompt accepts localDatetime as a variable. In evals, inject a fixed datetime matching when the fixture was captured:
// Deterministic — matches fixture expectations
const localDatetime = '2026-04-15, 10:00';
const prompt = await loadPrompt('chat-globe', { localDatetime });
Now "yesterday" reliably means 2026-04-14 every run. The golden fixture can optionally carry its own localDatetime so each test case locks to its own reference point.
Type 3: Sampled class evals
Golden and regression fixtures test individual cases. But when you see the same category of problem recurring — temporal misinterpretation, hallucinated numbers — you need class-level coverage. This is where sampled evals and class tags come in.
During admin triage, recurring problems get a class tag (e.g. class:temporal-interpretation, class:tool-call-grounding). These tags are stored in promoted_json.tags on the trace row. A sampled eval spec queries the traces table for rows matching a given class, seed-shuffles a sample, and re-executes each through the current pipeline:
// evals/sampled/temporal-interpretation.ts
export const temporalSpec: SampledEvalSpec = {
  name: 'temporal-interpretation',
  filter: {
    tag: 'class:temporal-interpretation',
    rating: 'down',
    promptName: 'chat-globe',
  },
  reExecute: async (trace, pipeline) => {
    const frozenTime = formatDatetime(trace.created_at);
    return pipeline.run(trace.input, { localDatetime: frozenTime });
  },
  judge: async (original, reExecuted) => {
    return llmJudge({
      criteria: 'date accuracy and tool-call grounding',
      original: original.output,
      reExecuted: reExecuted,
    });
  },
};
The sampler freezes localDatetime to the original trace's created_at, re-executes through the current pipeline, and an LLM judge scores the output. This tests the entire category dynamically — you don't need a fixture per bad trace.
| Class tag | What it catches | Judge criteria |
|---|---|---|
class:temporal-interpretation |
Wrong date ranges, timezone errors | Date correctness + tool grounding |
class:tool-call-grounding |
Hallucinated numbers, misquoted metrics | Factual grounding against source data |
# Run all sampled eval specs
pnpm eval:sampled

# Single class, controlled sample
DATASET=temporal-interpretation SAMPLE_LIMIT=10 SAMPLE_SEED=42 pnpm eval:sampled
The eval decision tree
The three eval types map to a simple decision:
Does the prompt call tools?
├── No  → Static eval. No DB needed. (insights.eval.ts)
└── Yes
    ├── Are the tool calls temporal?
    │   ├── Yes → Absolute dates + frozen clock + pinned user
    │   └── No  → Pinned user only
    └── Use service-role client + same executors as production

Is it a recurring class of problem?
└── Yes → Sampled eval with LLM judge (eval:sampled)
Running evals with Evalite
Evalite is a TypeScript-native eval runner built on Vitest. It gives CTI three things: a familiar .eval.ts file convention, built-in scoring via the autoevals library (Factuality, Levenshtein, custom scorers), and a local web UI for exploring results across runs.
Eval files sit alongside the codebase in evals/. Evalite auto-discovers any *.eval.ts file. Each file defines a dataset (from golden fixtures or DB queries), a task function (the code path under test), and scorers. The Evalite UI lets you compare scores across prompt versions — you can see exactly when a prompt change improved or degraded a specific class of queries.
# Run the full eval suite
pnpm eval

# Watch mode — re-runs on file change
pnpm eval --watch

# Evalite UI opens at localhost:3006
Because Evalite is Vitest-based, it integrates into CI. A failing eval score blocks the PR — the same way a failing unit test would. This is the mechanical enforcement of the loop: you can't ship a prompt change that regresses a golden fixture.
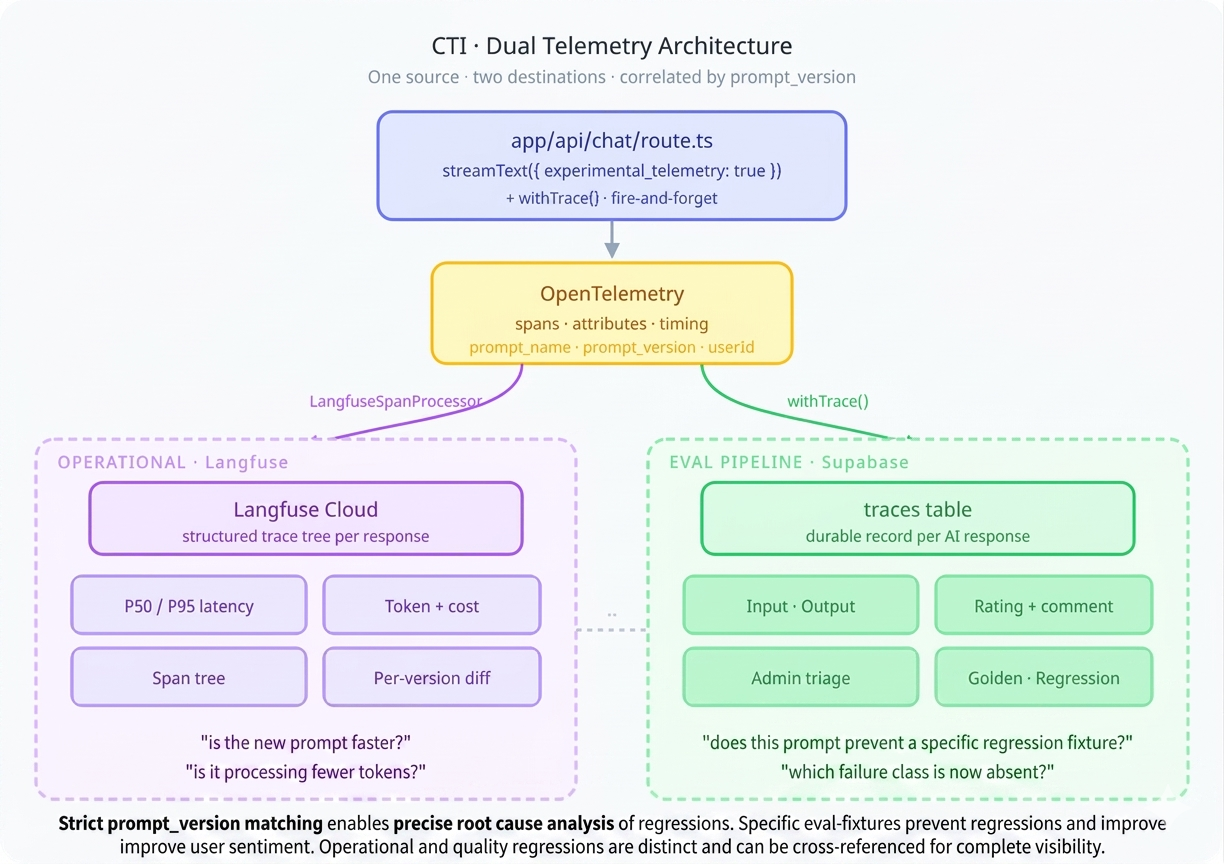
Telemetry with Langfuse
Traces in Supabase capture the eval-relevant data. Langfuse captures the operational telemetry: latency, token usage, cost, model selection, and the full span tree of multi-step interactions. They answer different questions and both matter.
Integration via OpenTelemetry
The Vercel AI SDK has built-in telemetry based on OpenTelemetry. Langfuse also uses OpenTelemetry. The integration is a span processor — no SDK wrapper, no monkey-patching:
// instrumentation.ts (Next.js instrumentation hook)
import { NodeTracerProvider } from '@opentelemetry/sdk-trace-node';
import { LangfuseSpanProcessor } from '@langfuse/otel';

export function register() {
  const provider = new NodeTracerProvider();

  provider.addSpanProcessor(
    new LangfuseSpanProcessor({
      publicKey: process.env.LANGFUSE_PUBLIC_KEY,
      secretKey: process.env.LANGFUSE_SECRET_KEY,
      baseUrl: process.env.LANGFUSE_BASE_URL,
    })
  );

  provider.register();
}
On the AI SDK side, telemetry is enabled per call with prompt version metadata:
const result = await streamText({
  model: getModel('smart'),
  system: prompt.content,
  messages,
  tools,
  experimental_telemetry: {
    isEnabled: true,
    metadata: {
      promptName: 'chat-globe',
      promptVersion: '2.4',
      userId,
      langfusePrompt: prompt.name,
    },
  },
});
The AI SDK creates spans for each operation — model calls, tool executions, streaming chunks. The LangfuseSpanProcessor intercepts these and forwards them to Langfuse, where they appear as structured traces with full timing, token counts, and cost breakdowns.
What Langfuse shows you
The Langfuse dashboard surfaces things the Supabase traces table doesn't optimise for: P50/P95 latency distributions across prompt versions, token-per-response trends (are your prompts getting bloated?), cost breakdowns by model tier, and the full span tree of a multi-tool interaction — you can see exactly how long searchRides took versus the model's generation time. A prompt change that increases latency 2× is visible immediately, segmented by version.
Closing the Loop
Here's how a concrete improvement cycle works in practice:
Monday. A user rates a response 👎 with the comment "it said I rode 3 times last week but I rode 4 times". The trace captures the input, output, prompt version 2.3, and the chat-globe prompt name.
Tuesday. Admin opens /admin/traces, finds the trace in the inbox. The model called searchRides with the right date range but miscounted in the summary. Tags it class:temporal-interpretation. Promotes it to a regression fixture: evals/regressions/07-ride-count.json. Marks reviewed.
Wednesday. Developer updates the prompt to include explicit counting instructions when presenting ride lists. Version bumps to 2.4. Runs pnpm eval — the new regression fixture catches the counting error with the old prompt and passes with the new one. The sampled eval for temporal-interpretation also shows improvement across the class.
Thursday. PR merges. The new prompt is live. Langfuse shows the version change in its timeline. Latency is flat — the added instructions didn't bloat the response.
Next Monday. The same user tries a similar query. It works. They don't rate it — most correct responses go unrated, and that's fine. But if something regresses, the fixtures catch it before any user does.
The compounding effect is the point. Every triage session adds 2–5 fixtures. After a few months you have hundreds of cases — golden and regression — forming a comprehensive test surface. Prompt changes are no longer "deploy and pray". They're "deploy and prove".
What I'd Do Differently
The trace review UI works but the promotion flow — copy JSON, save to file, run eval manually — has too many manual steps. A direct "promote and commit" button that writes the fixture file and triggers the eval run would cut the friction significantly.
The sampled eval system queries production traces, which means it needs network access to the database in CI. For now, sampled evals run locally. Moving them to CI would require either a read replica or a periodic snapshot of tagged traces into the repo.
Class tags are currently free-text strings. A stricter enum (backed by the eval spec registry) would prevent typos and make it clearer which tags have eval coverage and which are just annotations.
Stack additions since Part 2: Evalite, autoevals, Langfuse, @langfuse/otel, OpenTelemetry SDK
Built with: Claude Opus 4.6 via Claude Code CLI
Most domain-specific AI products don't have an evals loop like this. They ship, they degrade, no one notices until a user complains. Building this kind of trace-and-regression machinery into a client product — so prompt changes are "deploy and prove" instead of "deploy and pray" — is exactly what Orbital does. Read the CTI case study →
The CTI series:
- Building Cycling Training Intelligence in One Week with Claude Code
- CTI's AI Architecture: How the Coaching Layer Works
- CTI's Reinforcing Evals Loop: Prompts, Skills, Traces & Telemetry
- CTI's MCP Server: Making the Coach Composable
- CTI's Fitness Metrics: TSS, CTL, ATL, TSB — the Numbers Behind the Coach
- Future-Proofing CTI: An Architecture Review and Roadmap