Example Projects
These projects demonstrate the core problems I solve: making distributed systems explorable, designing effective human-in-loop AI, and building interfaces for complex technical infrastructure.
Each represents deep integration work that off-the-shelf tools couldn't solve.
- Cycling Training Intelligence: Interactive 3D geospatial route viewer plus a grounded AI coaching layer with three-tier memory, hybrid retrieval, a reinforcing evals loop, and an authenticated MCP server
- Deep Search: Production AI research pipeline with observability and evaluation frameworks
- Darwinium: Making complex fraud networks visible through interactive graph visualization
- Syft: Real-time monitoring for globally distributed instrument fleets
- Mersen R-TOOLS: Engineering simulation UX handling long-running async compute workloads
Cycling Training Intelligence
The Problem: Indoor cycling training data was trapped in binary files — just numbers and GPS coordinates. Athletes needed to explore their training routes cinematically, and needed an AI coach whose advice was grounded in their actual power data, fitness trajectory, and past coaching conversations rather than the generic blog content every off-the-shelf LLM falls back on.
What I Built: A full coaching platform — an interactive 3D route viewer that turns FIT files into cinematic experiences, plus an AI coaching layer with intent routing, layered prompts, three-tier memory, and hybrid retrieval, plus a reinforcing evals loop that improves the coach with every user interaction, plus an authenticated MCP server that makes the same coach composable inside Claude Desktop, n8n, Zapier, and other agent hosts. The coaching layer reasons over the Performance Management Chart (CTL/ATL/TSB) — the same fifty-year-old impulse-response model human coaches use — so every recommendation is anchored in the rider's own numbers, not textbook averages.
3D Route Viewer
- 3D terrain rendering with cinematic camera animations following route progress
- Real-time synchronized charts for elevation, speed, power, heart rate, and cadence
- Binary FIT file parsing and validation with resumable TUS uploads
- M4 downsampling algorithm for 60fps performance with thousands of data points
AI Coaching Architecture
- PII redaction in-place at the top of the pipeline — single source of truth, no downstream code path can skip it
- Haiku-as-router classifies every message into one of five intents (workout generation, ride analysis, route search, coaching chat, off-topic) with a hard short-circuit for off-topic that saves the Sonnet call entirely
- Ten-layer system prompt assembled per-request (safety block, view-specific base prompt, profile memory, ride data, route context, search context, episodic context, intent hint, skills manifest) — context injected as XML tags, not free prose, so the model treats it as data rather than instructions
- Three-tier memory: permanent profile memory (FTP, weight, goals) on the user row; per-session episodic memories with key insights, athlete signals, and open questions; and full chat-message indexing chunked on structural boundaries
- Hybrid search via Reciprocal Rank Fusion across four parallel Supabase RPCs (keyword + semantic on chat messages and session memories), with a Haiku-extracted query analysis step targeting the right slice of history
- Skills system — markdown-with-frontmatter SKILL.md files for
/ride,/week,/form,/training— preloaded for known intents and runtime-discoverable vialist_skills/load_skilltools - Per-task model slot system through Vercel AI Gateway: Haiku for cheap high-frequency tasks, Sonnet for coaching responses, Gemini Flash Lite for insights, OpenAI embeddings for vectors — swapping a model is a one-line config change
Reinforcing Evals Loop
- Prompt versioning with stable IDs flowing into both the
tracestable and Langfuse metadata, so every AI response is permanently linked to the exact prompt version that produced it - Admin trace triage UI that promotes real production failures into Evalite golden + regression fixtures
- CI-runnable Evalite suite that gates prompt and skill changes against the fixture set
- OpenTelemetry + Langfuse telemetry for P50/P95 latency, token-per-response trends, cost breakdowns by model tier, and full multi-step span trees per prompt version
MCP Server
- OAuth 2.1 + PKCE for interactive clients (Claude Desktop) plus Personal Access Tokens for scripts and cron jobs, both resolving to the same opaque-token table with SHA-256 hashing at rest
- Tools, resources, and prompts mirroring the web chat surface (search rides, get fitness state, generate workouts, ask the coach) with coarse-grained additive scopes (
rides:read,insights:generate,chat:send, …) and double-checked authorization at registration and execute time - The
ask_coachMCP tool reuses the exact samerunChatPipeline()the web UI calls — same PII redaction, same intent router, same off-topic short-circuit, same safety layer — so security and coaching-quality logic never drift between transports - Per-user, per-client, per-cost-class rate limits so a chatty Zapier cron can't starve the user's daily generation budget
Domain Model: PMC, TSS, CTL/ATL/TSB
- Critical Power and Normalized Power computed from raw
.fitfiles, feeding TSS for every ride - Performance Management Chart with exponentially weighted Fitness (CTL ~42d), Fatigue (ATL ~7d), and Form (TSB) — the quantitative model the coach reasons in for every "how am I going?" and "should I push today?"
- Subjective Feeling and RPE captured per ride and merged with the objective metrics, so the coach can distinguish "TSB says you're fresh but you reported feeling cooked"
Stack: React, Next.js, TypeScript, Mapbox GL JS, Turf.js, Supabase (Postgres + pgvector HNSW + GIN full-text), Vercel AI SDK, Vercel AI Gateway, Claude Sonnet 4.6, Claude Haiku 4.5, OpenAI text-embedding-3-small, Gemini Flash Lite, Evalite, Langfuse, OpenTelemetry, @modelcontextprotocol/sdk, OAuth 2.1 + PKCE
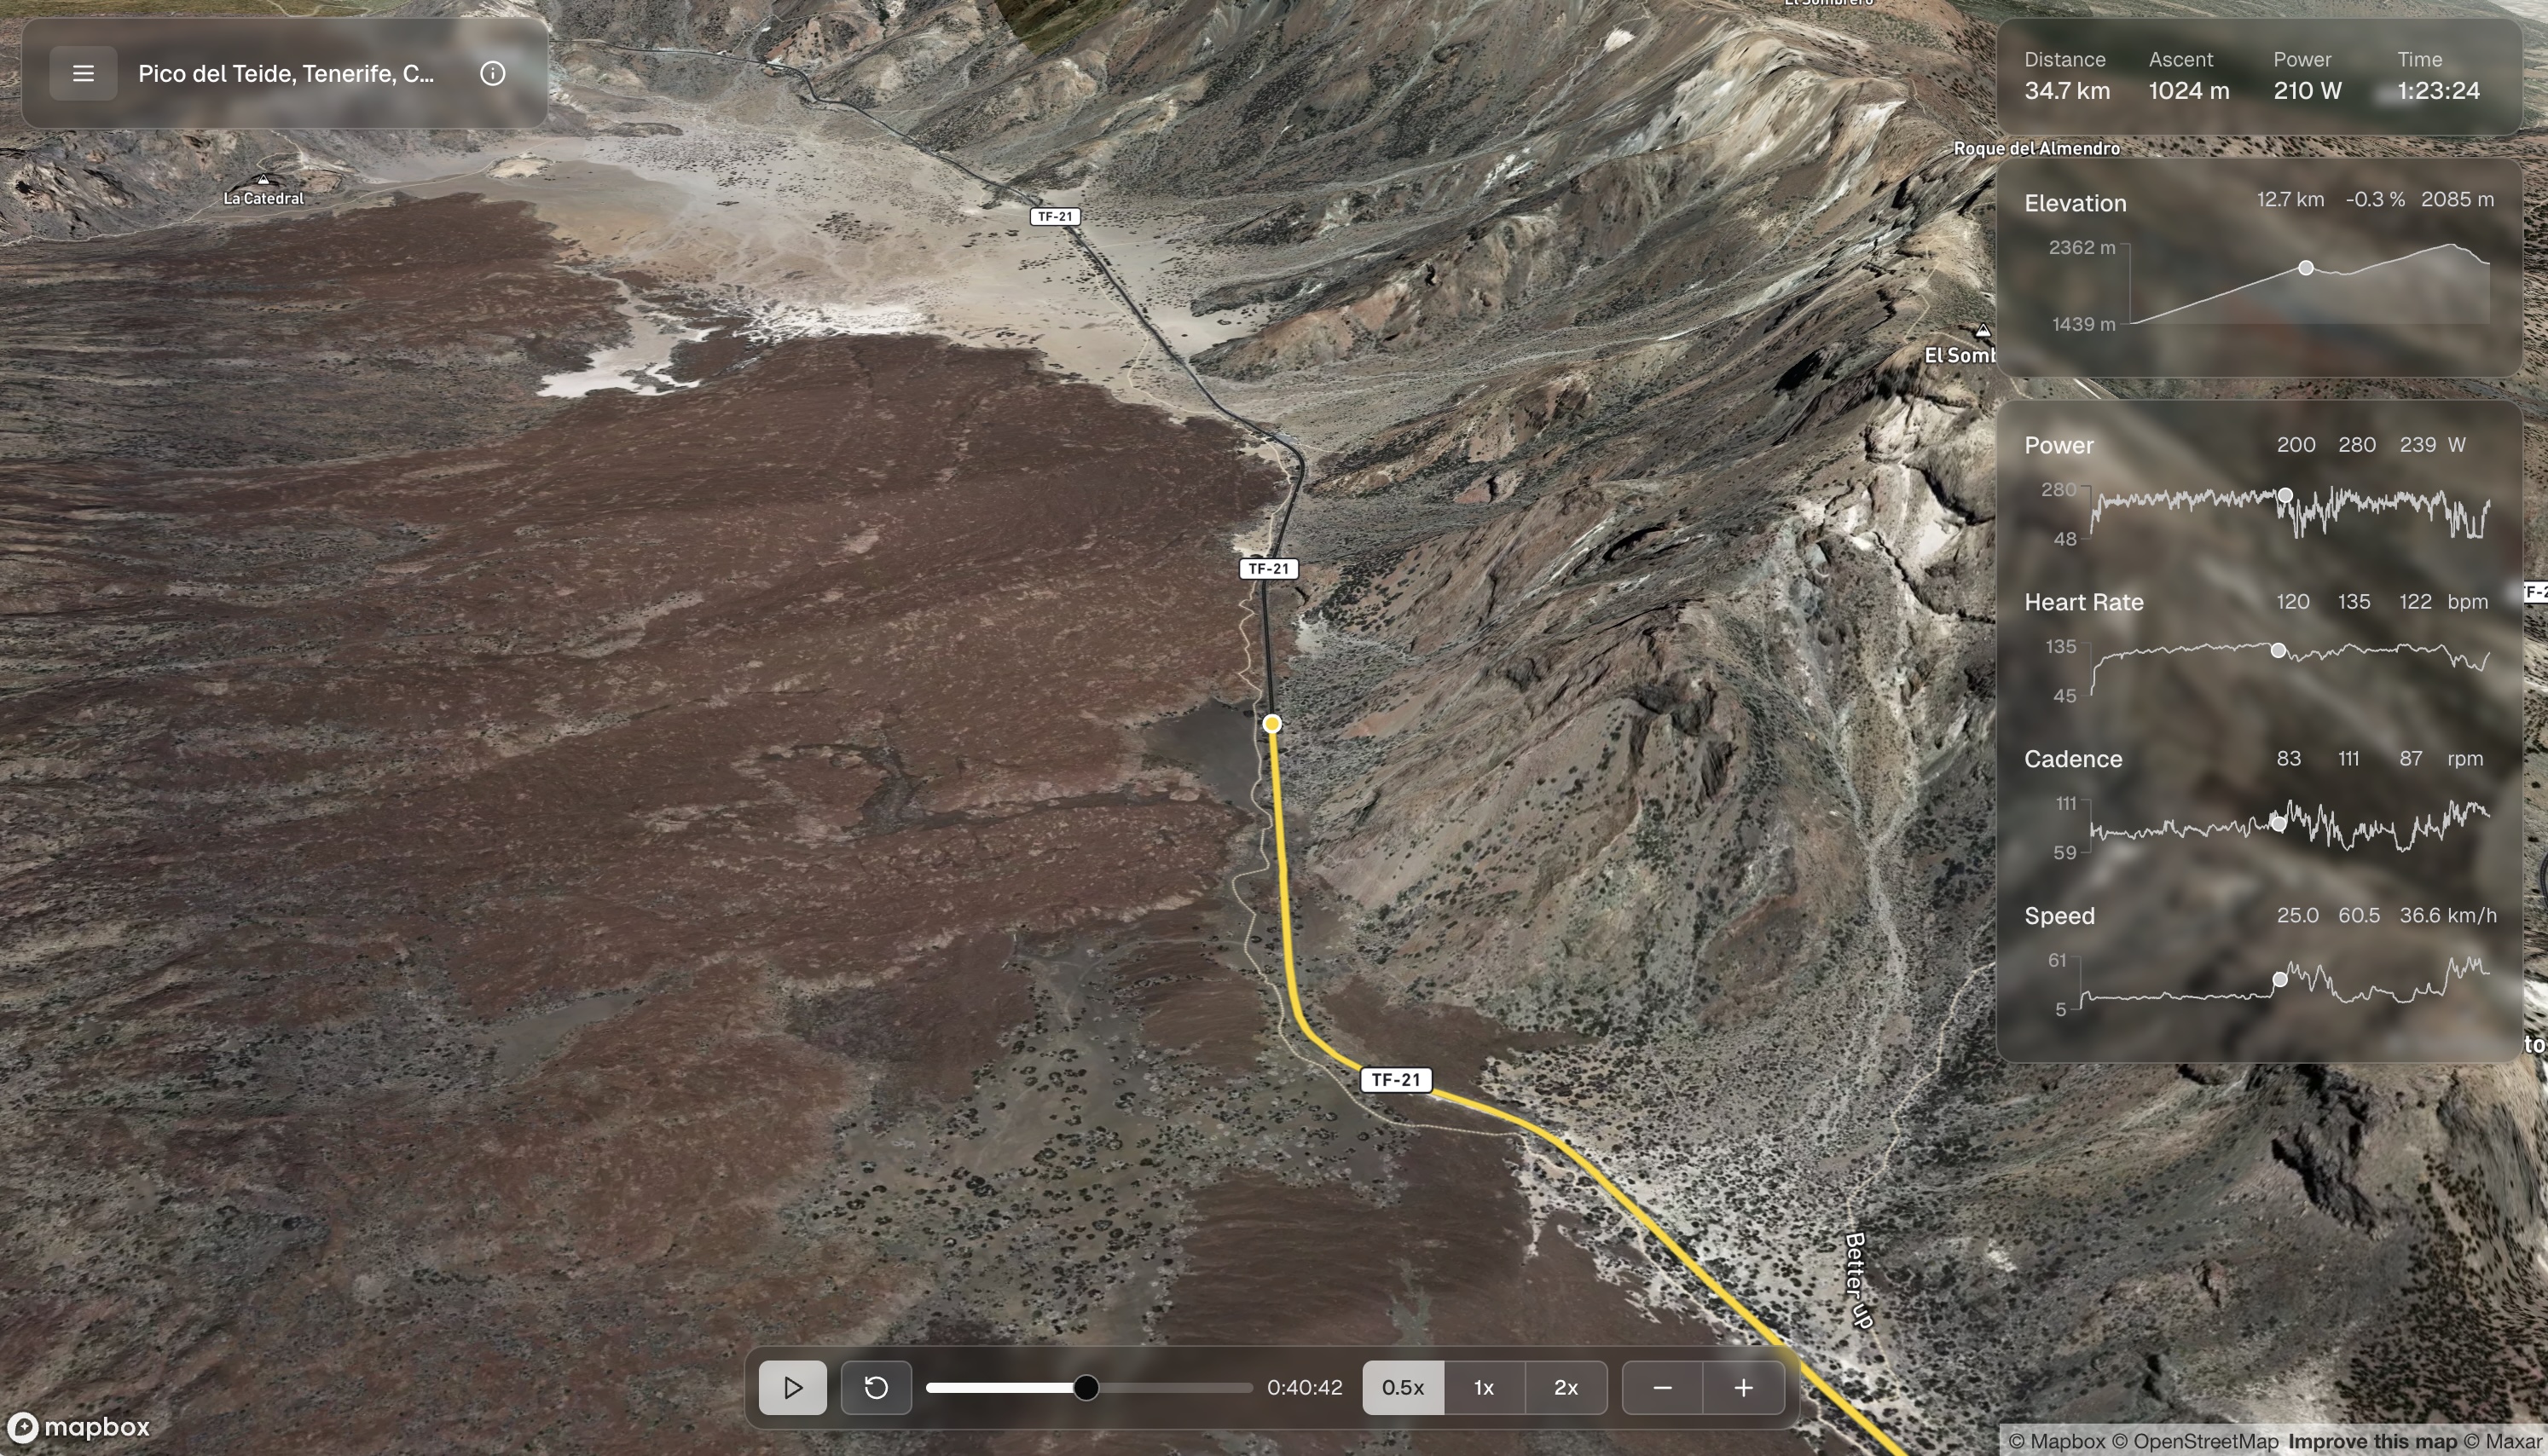
3D Cinematic Route — Pico del Teide, Tenerife, Canary Islands.
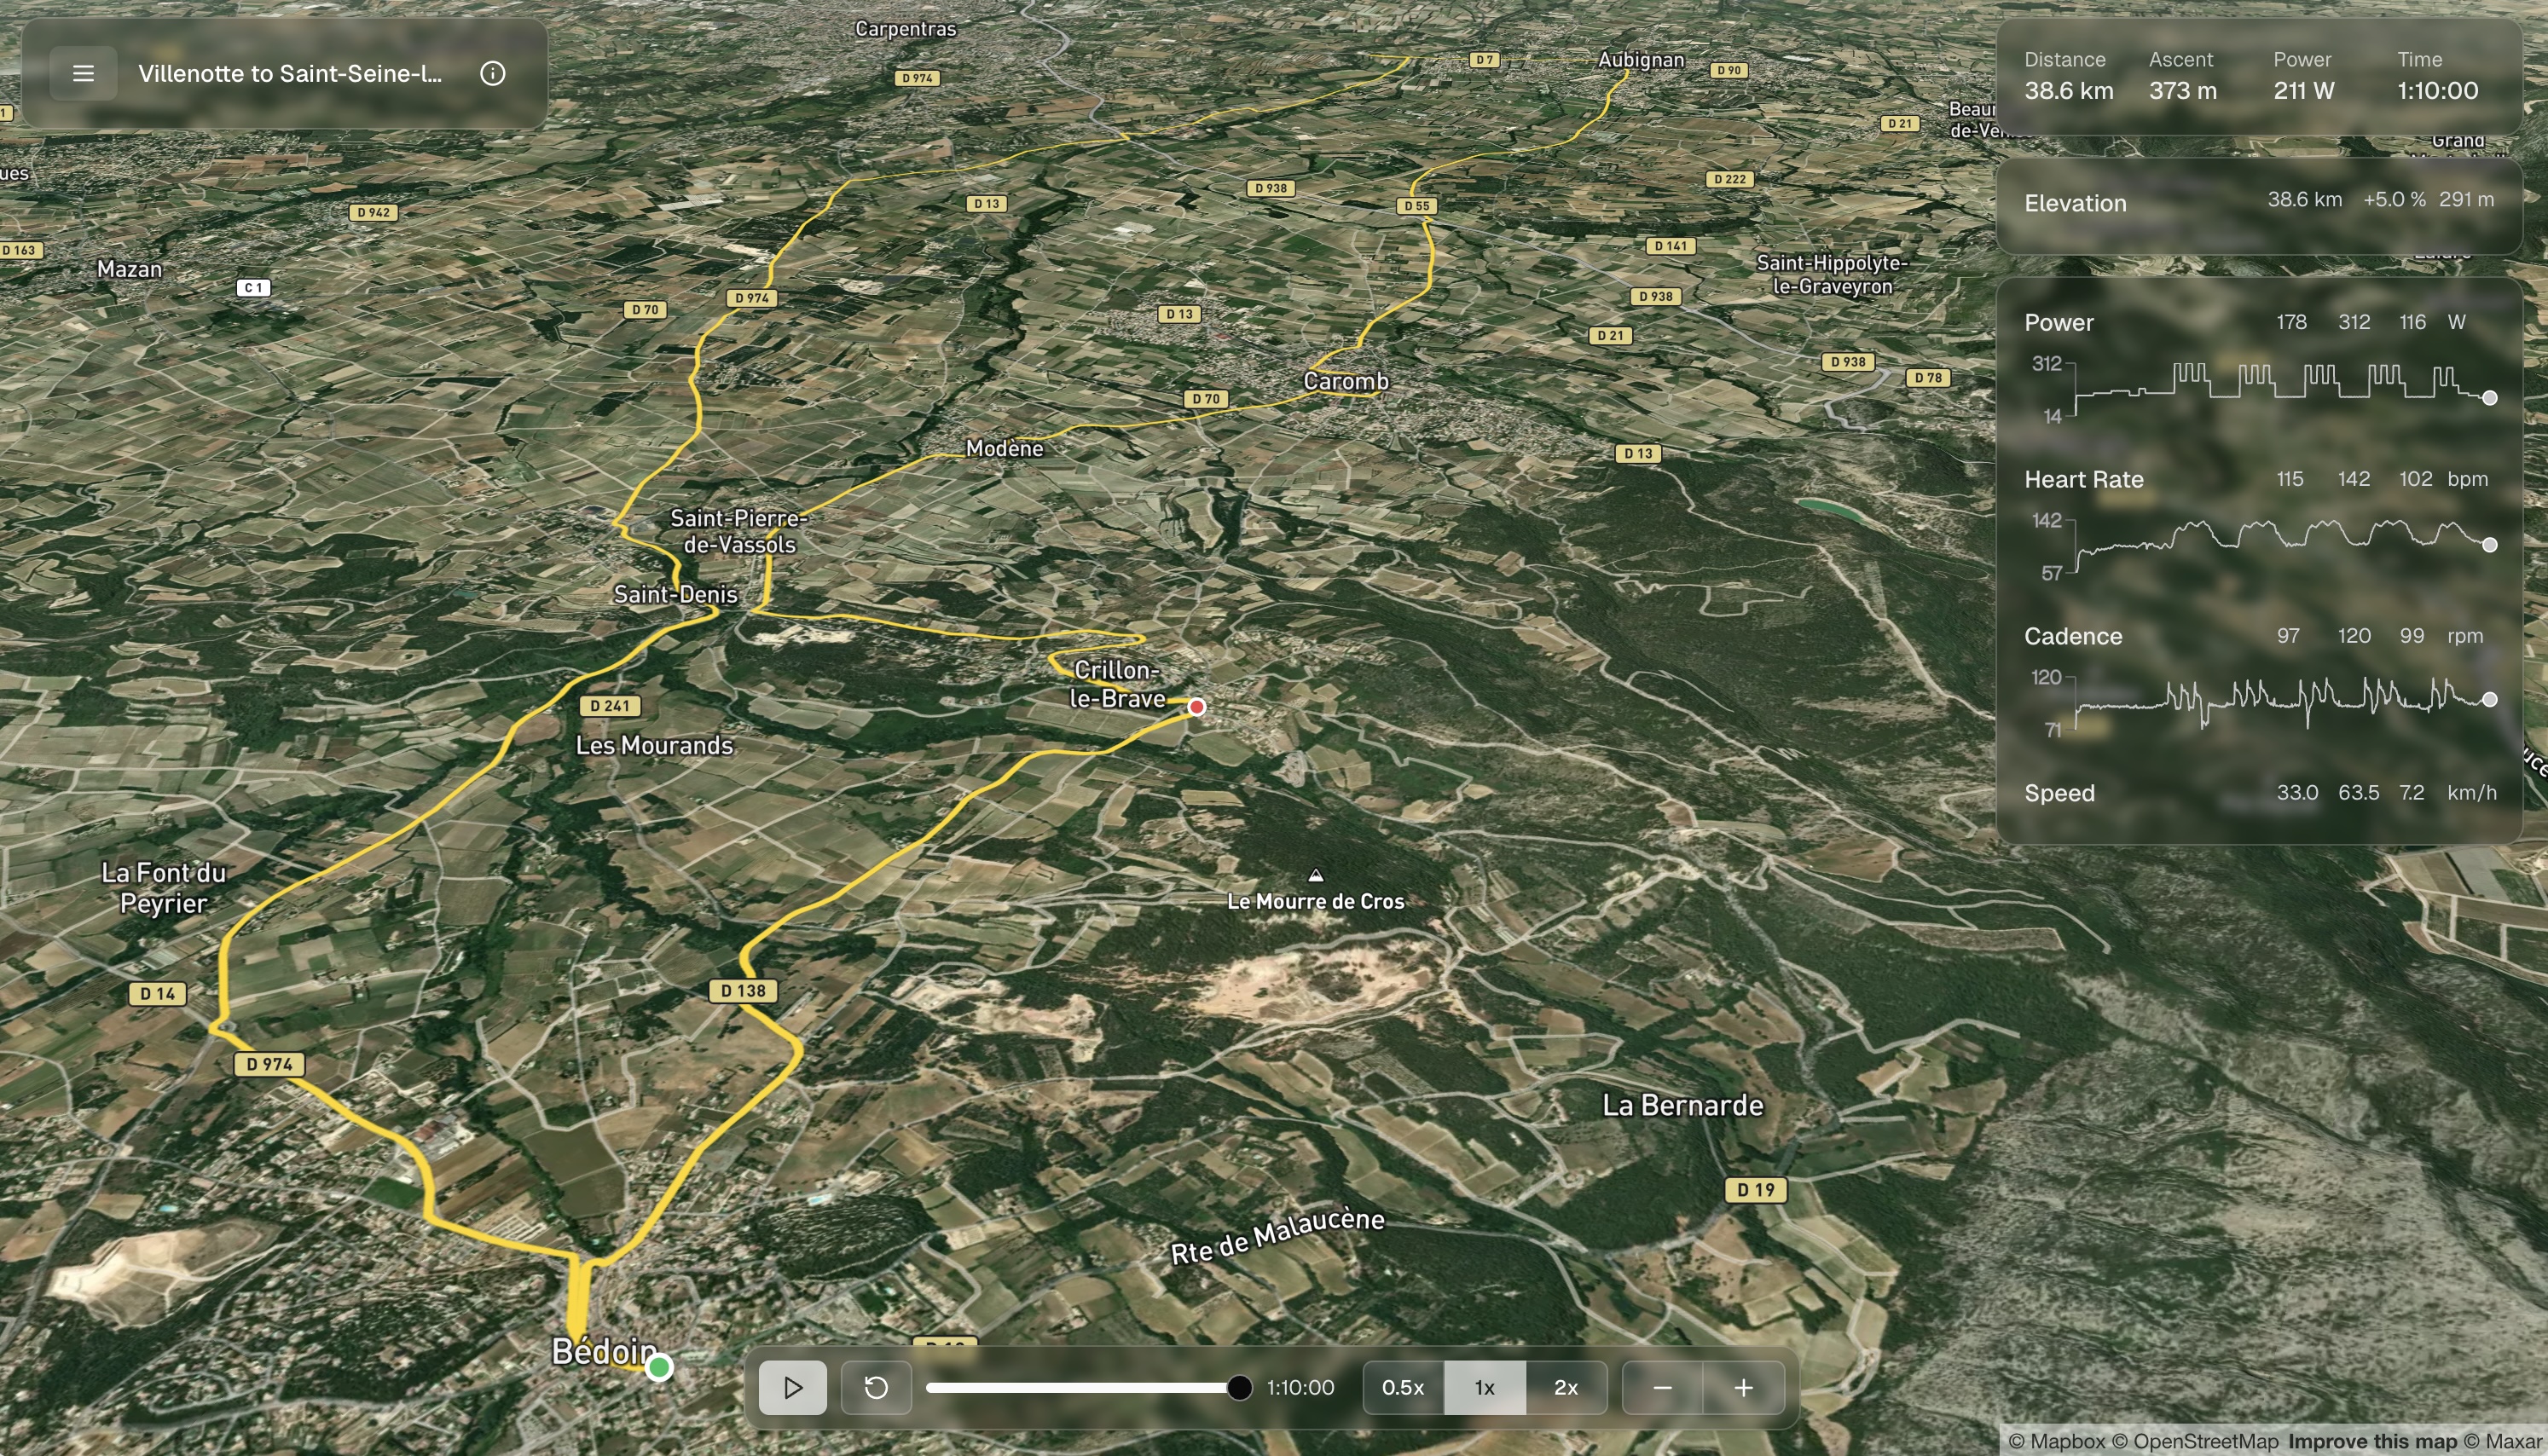
3D Cinematic Route with Workout Performance Charts — Rolling Thunder Workout, Villenotte to Saint-Seine-l'Abbaye, France.
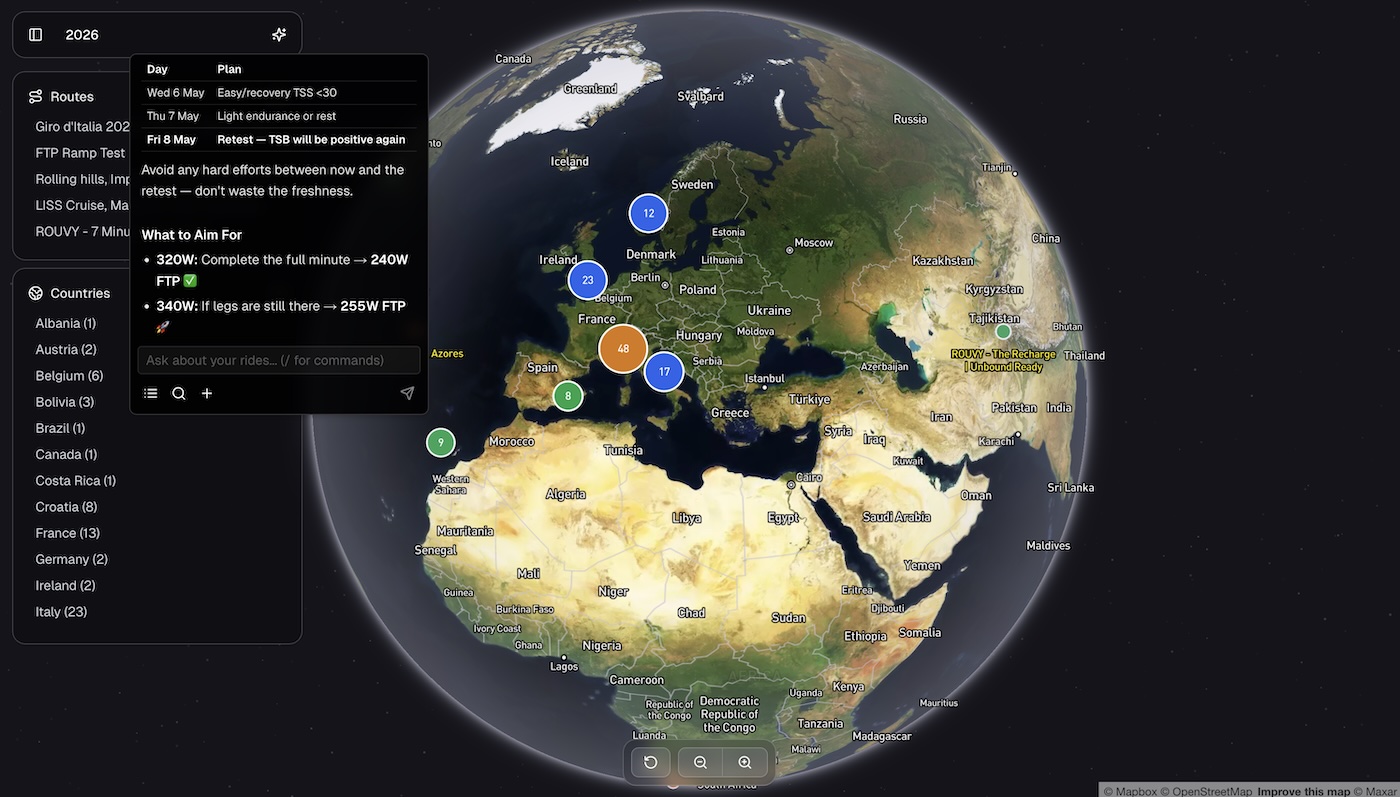
Grounded AI Coach — Coaching responses anchored in the rider's actual rides, fitness state, and past conversations. The chat sits alongside the globe view; the same runChatPipeline() runs whether the question came from the web UI or an MCP client.
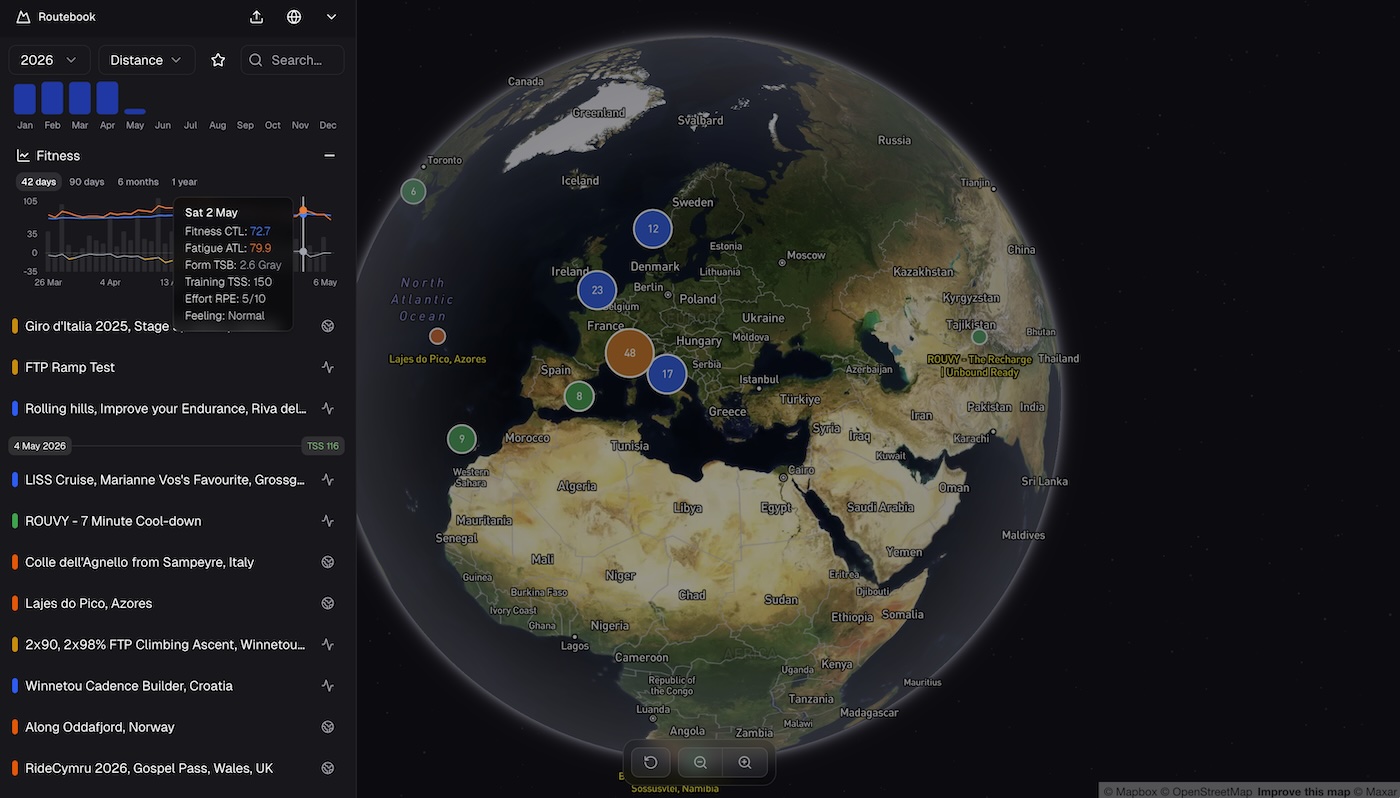
Performance Management Chart — CTL (Fitness), ATL (Fatigue), TSB (Form) computed from daily TSS. The quantitative model the coach reasons in for every load and recovery decision.
The CTI series — full case studies:
- Building Cycling Training Intelligence in One Week with Claude Code — the foundation: 3D route viewer, FIT-file parsing, real-time charts
- CTI's AI Architecture: How the Coaching Layer Works — intent routing, layered prompts, three-tier memory, hybrid retrieval
- CTI's Reinforcing Evals Loop: Prompts, Skills, Traces & Telemetry — prompt versioning, trace capture, regression fixtures, triage UI
- CTI's MCP Server: Making the Coach Composable — OAuth 2.1, PATs, tool surface, per-user scoping
- CTI's Fitness Metrics: TSS, CTL, ATL, TSB — the domain model the coach reasons in
- Future-Proofing CTI: An Architecture Review and Roadmap — what to revisit on every model release, where the architecture should evolve, what's missing
CTI is live in production at routebook.app.
Deep Search: Production AI Research Pipeline
The Problem: Generic AI search tools couldn't handle rate-limiting, prompt versioning, or provide observability needed for production use. Teams needed AI search they could actually deploy and monitor.
What I Built: A production-grade deep search application with full engineering observability, evaluation frameworks, and prompt management. Not a demo—a system designed to run reliably at scale.
Core Capabilities:
- Distributed rate-limiting across search providers
- Local evaluation framework for rapid iteration
- Full observability with traces and metrics
- Prompt versioning and A/B testing infrastructure
Stack: React, Next.js, AI SDK, Postgres, Redis
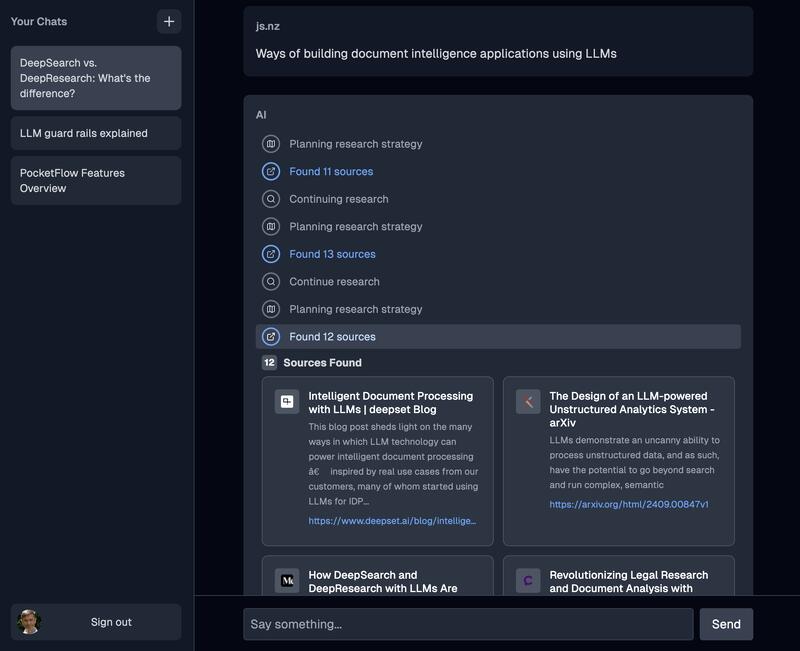
Deep Search Sources — Expandable showing sources scraped for detailed information.
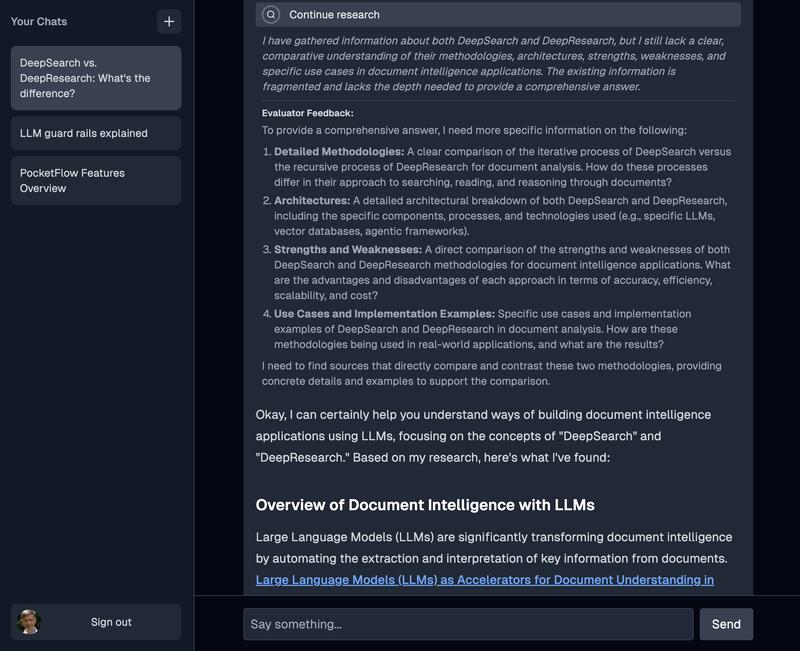
Deep Search Research — Expandable showing LLM response with planned actions.
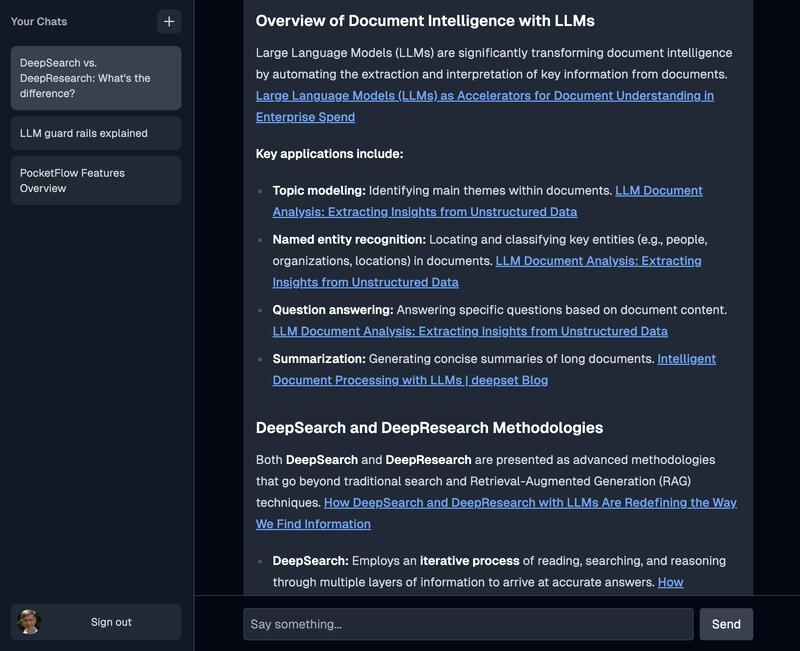
Deep Search Answer — Final answer with links for reference sources.
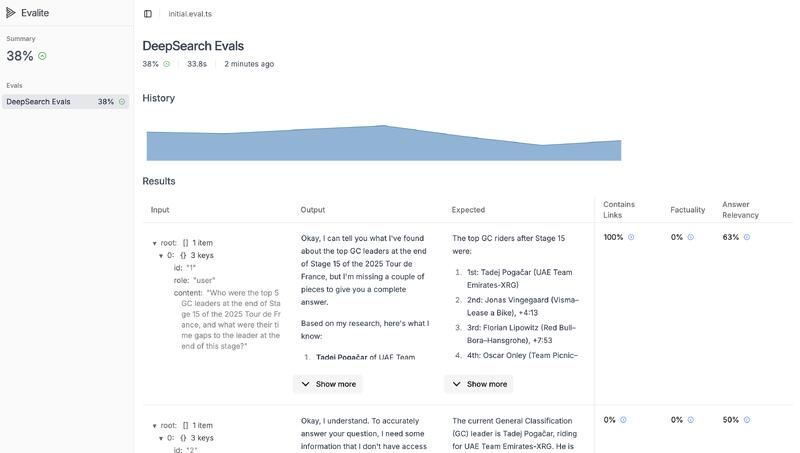
Deep Search Local Evals — Local evals run on your development server and make iteration quick and easy.
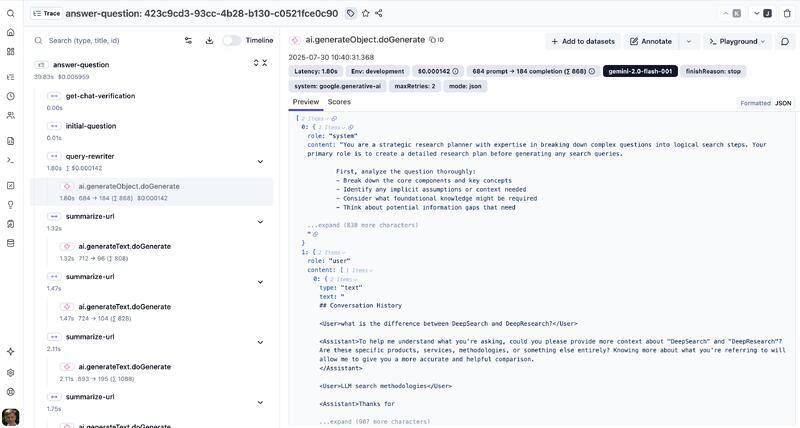
Deep Search Engineering Observability — Platform provides continuous observability with traces, evals and provides prompt management and metrics for continual improvement.
Darwinium: Making Fraud Networks Visible
The Problem: Fraud detection generates complex relationship graphs that are impossible to understand with standard dashboards. Analysts needed to explore network patterns in real-time, not just view static reports.
What I Built: Interactive network visualization and real-time dashboards that made fraud patterns explorable. Custom graph layouts, filtering, and grouping that revealed patterns hidden in the raw data.
Core Capabilities:
- Interactive network graphs with custom node types and relationships
- Real-time dashboard system with user-configurable layouts
- Geospatial visualization with Mapbox integration
- High-performance rendering for large-scale fraud networks
Stack: React, AntV (G6), Mapbox, GraphQL
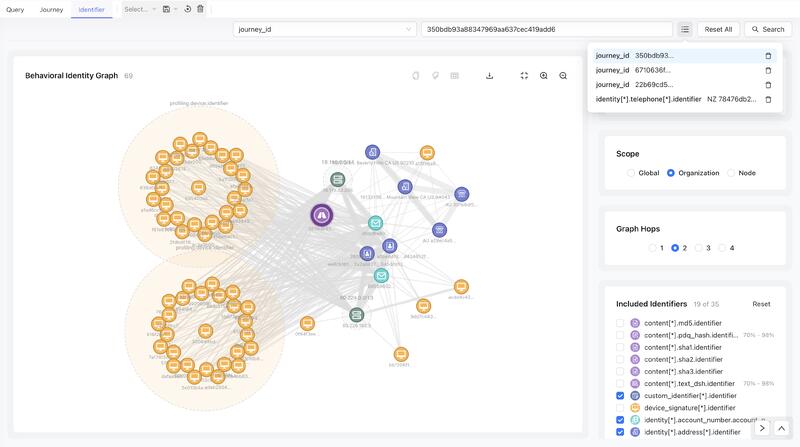
Identity Graph — Interactive Network Graphs with custom nodes, grouping, linking and filtering.
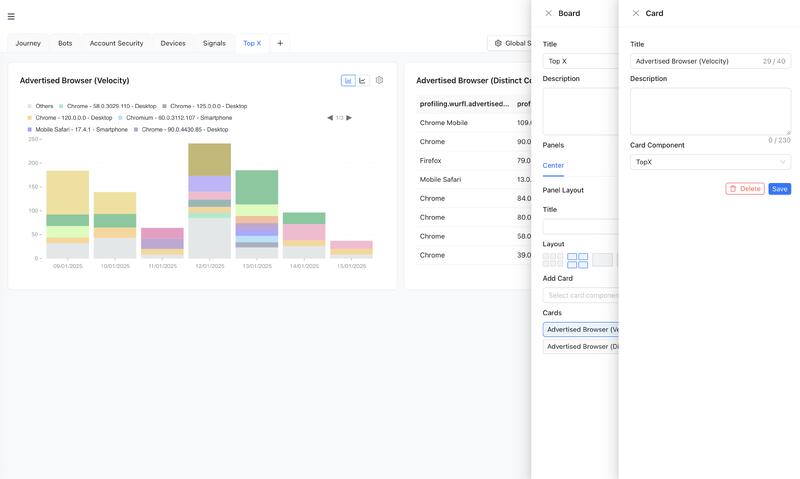
Dashboard Cards — Configurable cards allow selecting custom data rendering components for each card.
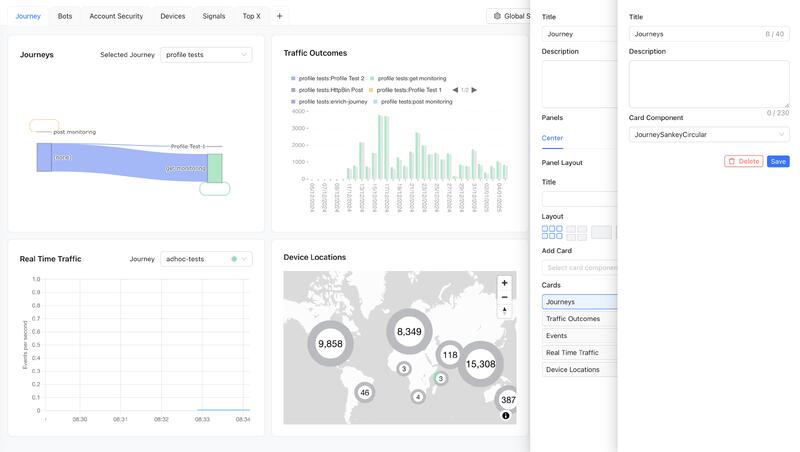
Dashboard Layout — Multiple dashboards are supported using tabs. Each dashboard has user configurable resizable panels and tab layouts. Panels have user configurable card layouts and card positioning.
Syft: Distributed Instrument Fleet Monitoring
The Problem: Mass spectrometry instruments deployed globally generated performance data that was invisible until failures occurred. Teams needed real-time visibility into instrument health across entire fleets.
What I Built: Real-time monitoring dashboard that ingested IoT data streams and surfaced instrument health patterns. Made distributed hardware infrastructure understandable through visual summaries and performance timelines.
Core Capabilities:
- Fleet-wide health visualization at a glance
- Real-time performance tracking for individual instruments
- IoT data ingestion and processing pipeline
- Context-aware help system tailored to customer configurations
Stack: React, Recoil, AntD, Python GraphQL, AWS IoT/data stack
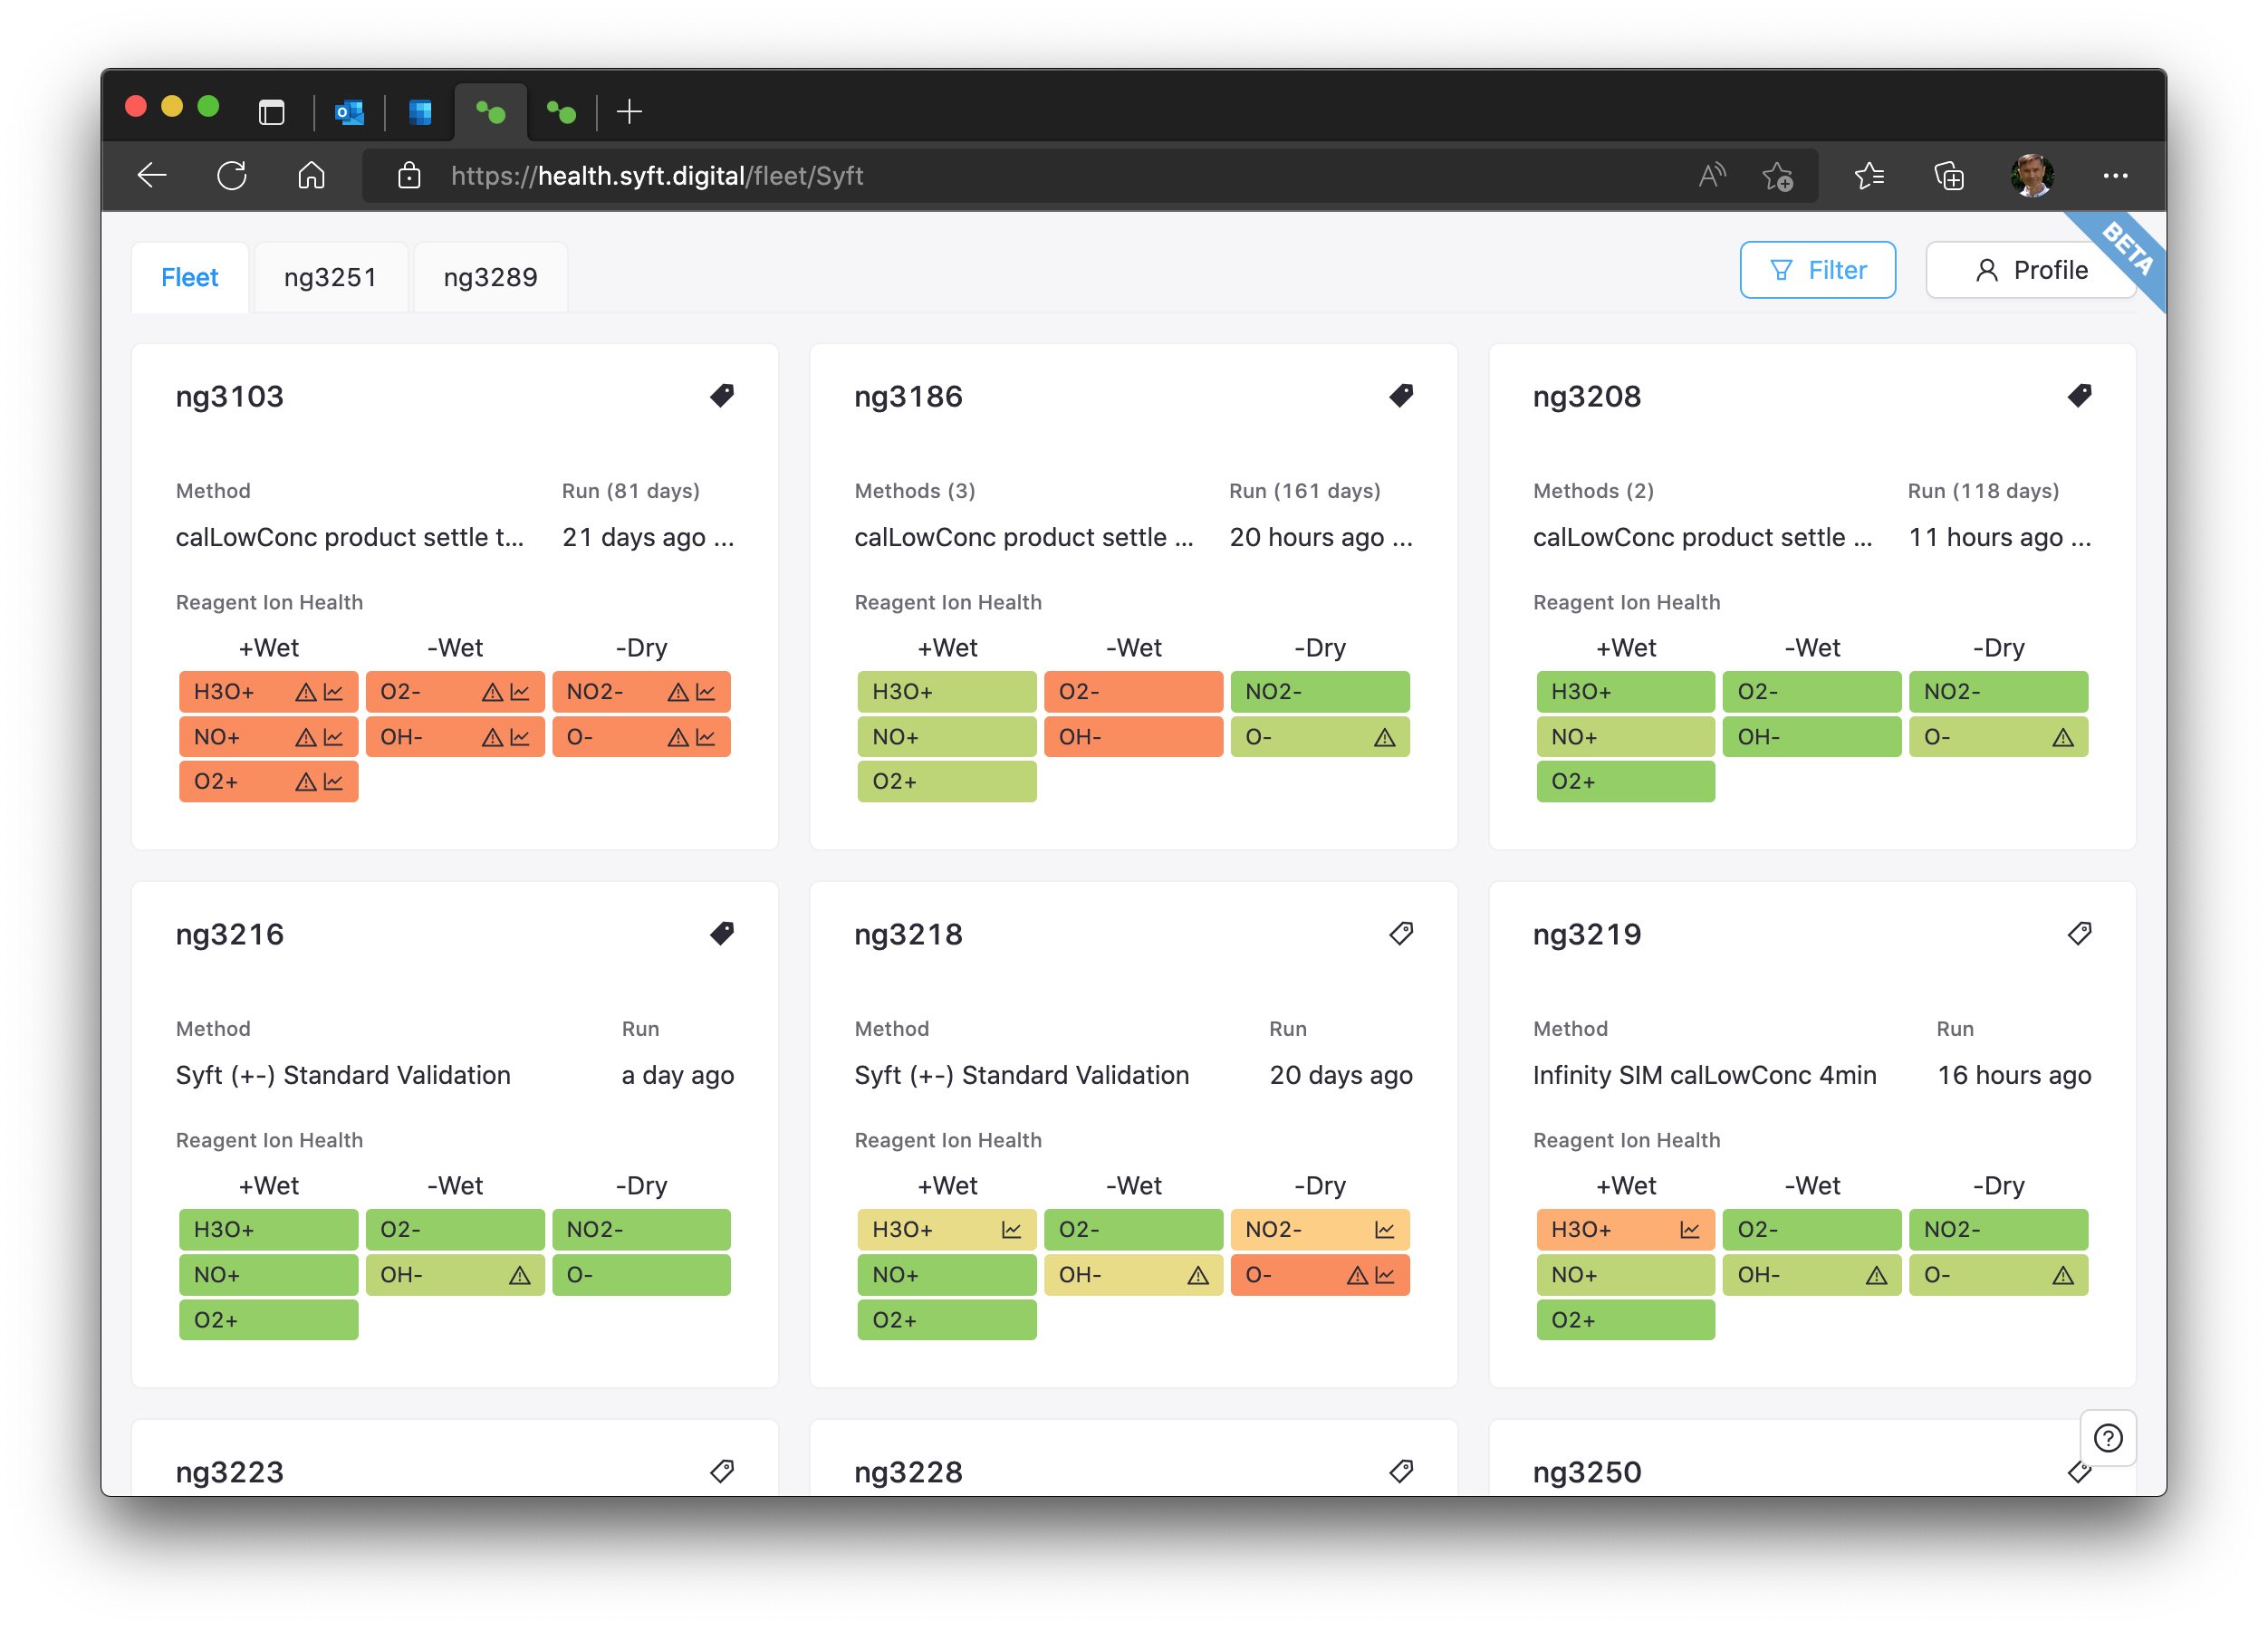
Instrument Fleet — Cards provide a quick visual overview of the health of all instruments deployed in the fleet.
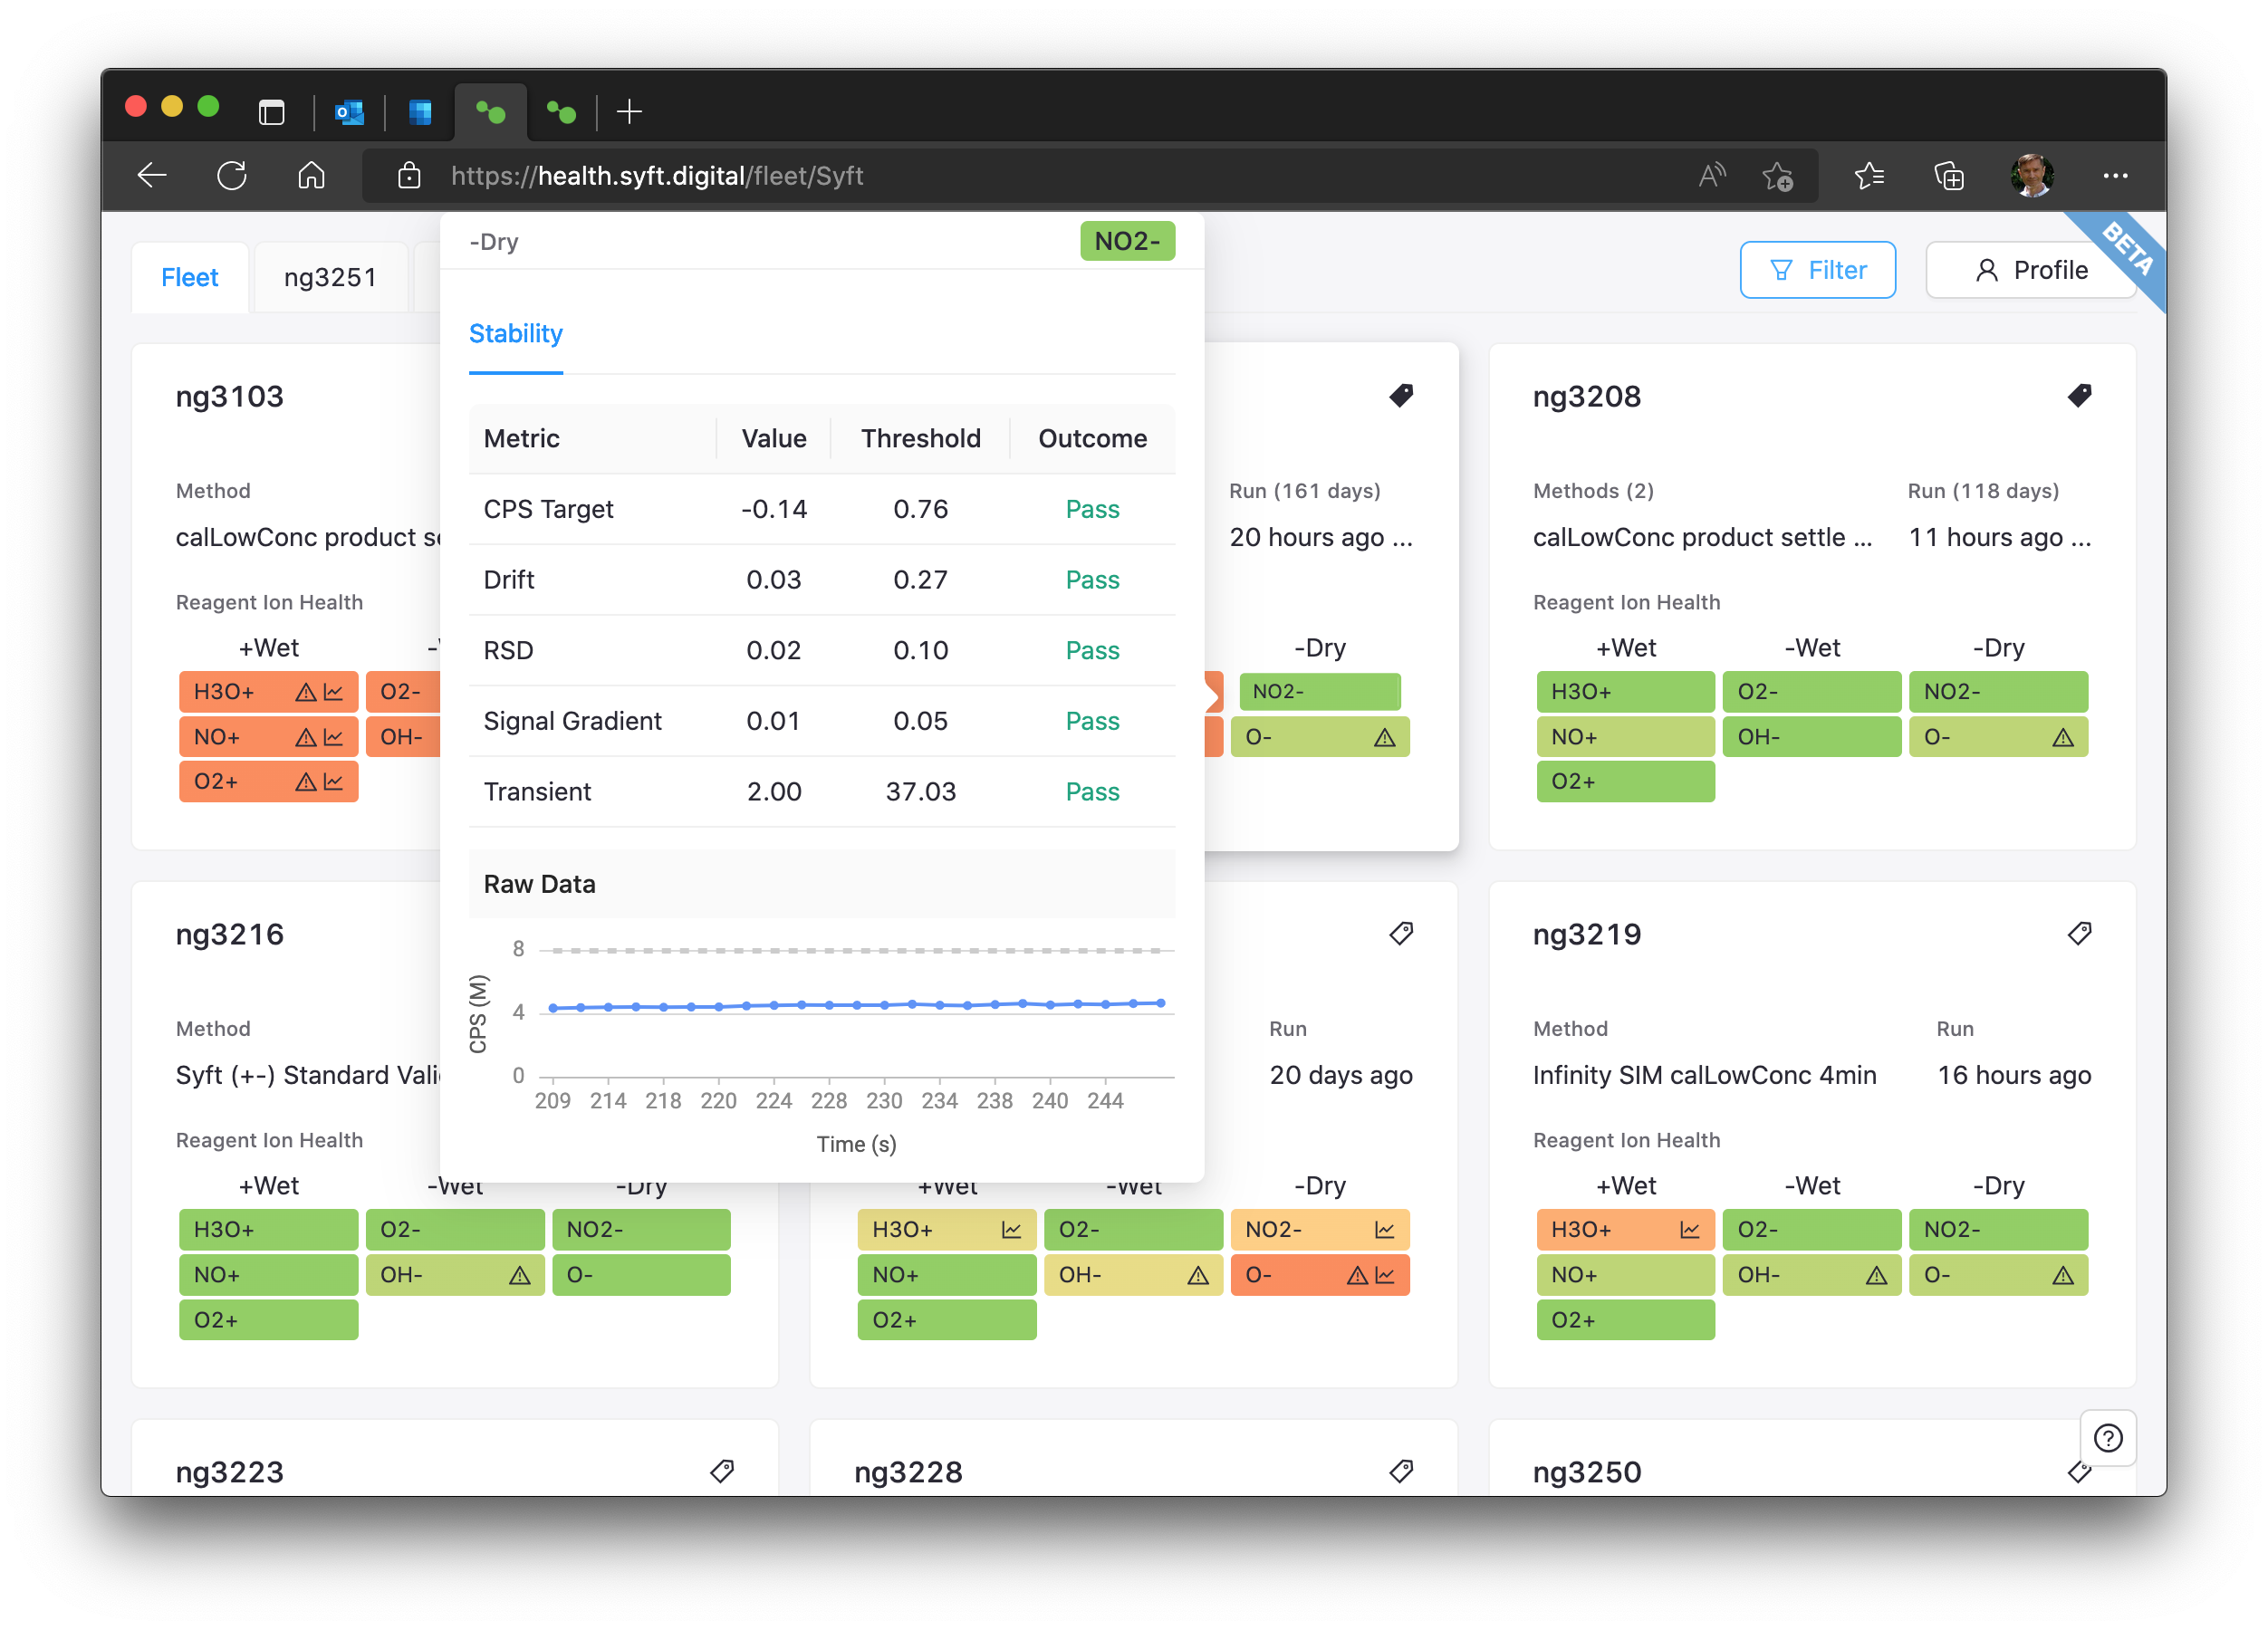
Instrument Quick View — Easily see more details for the reagent of a specific instrument from the fleet list view.
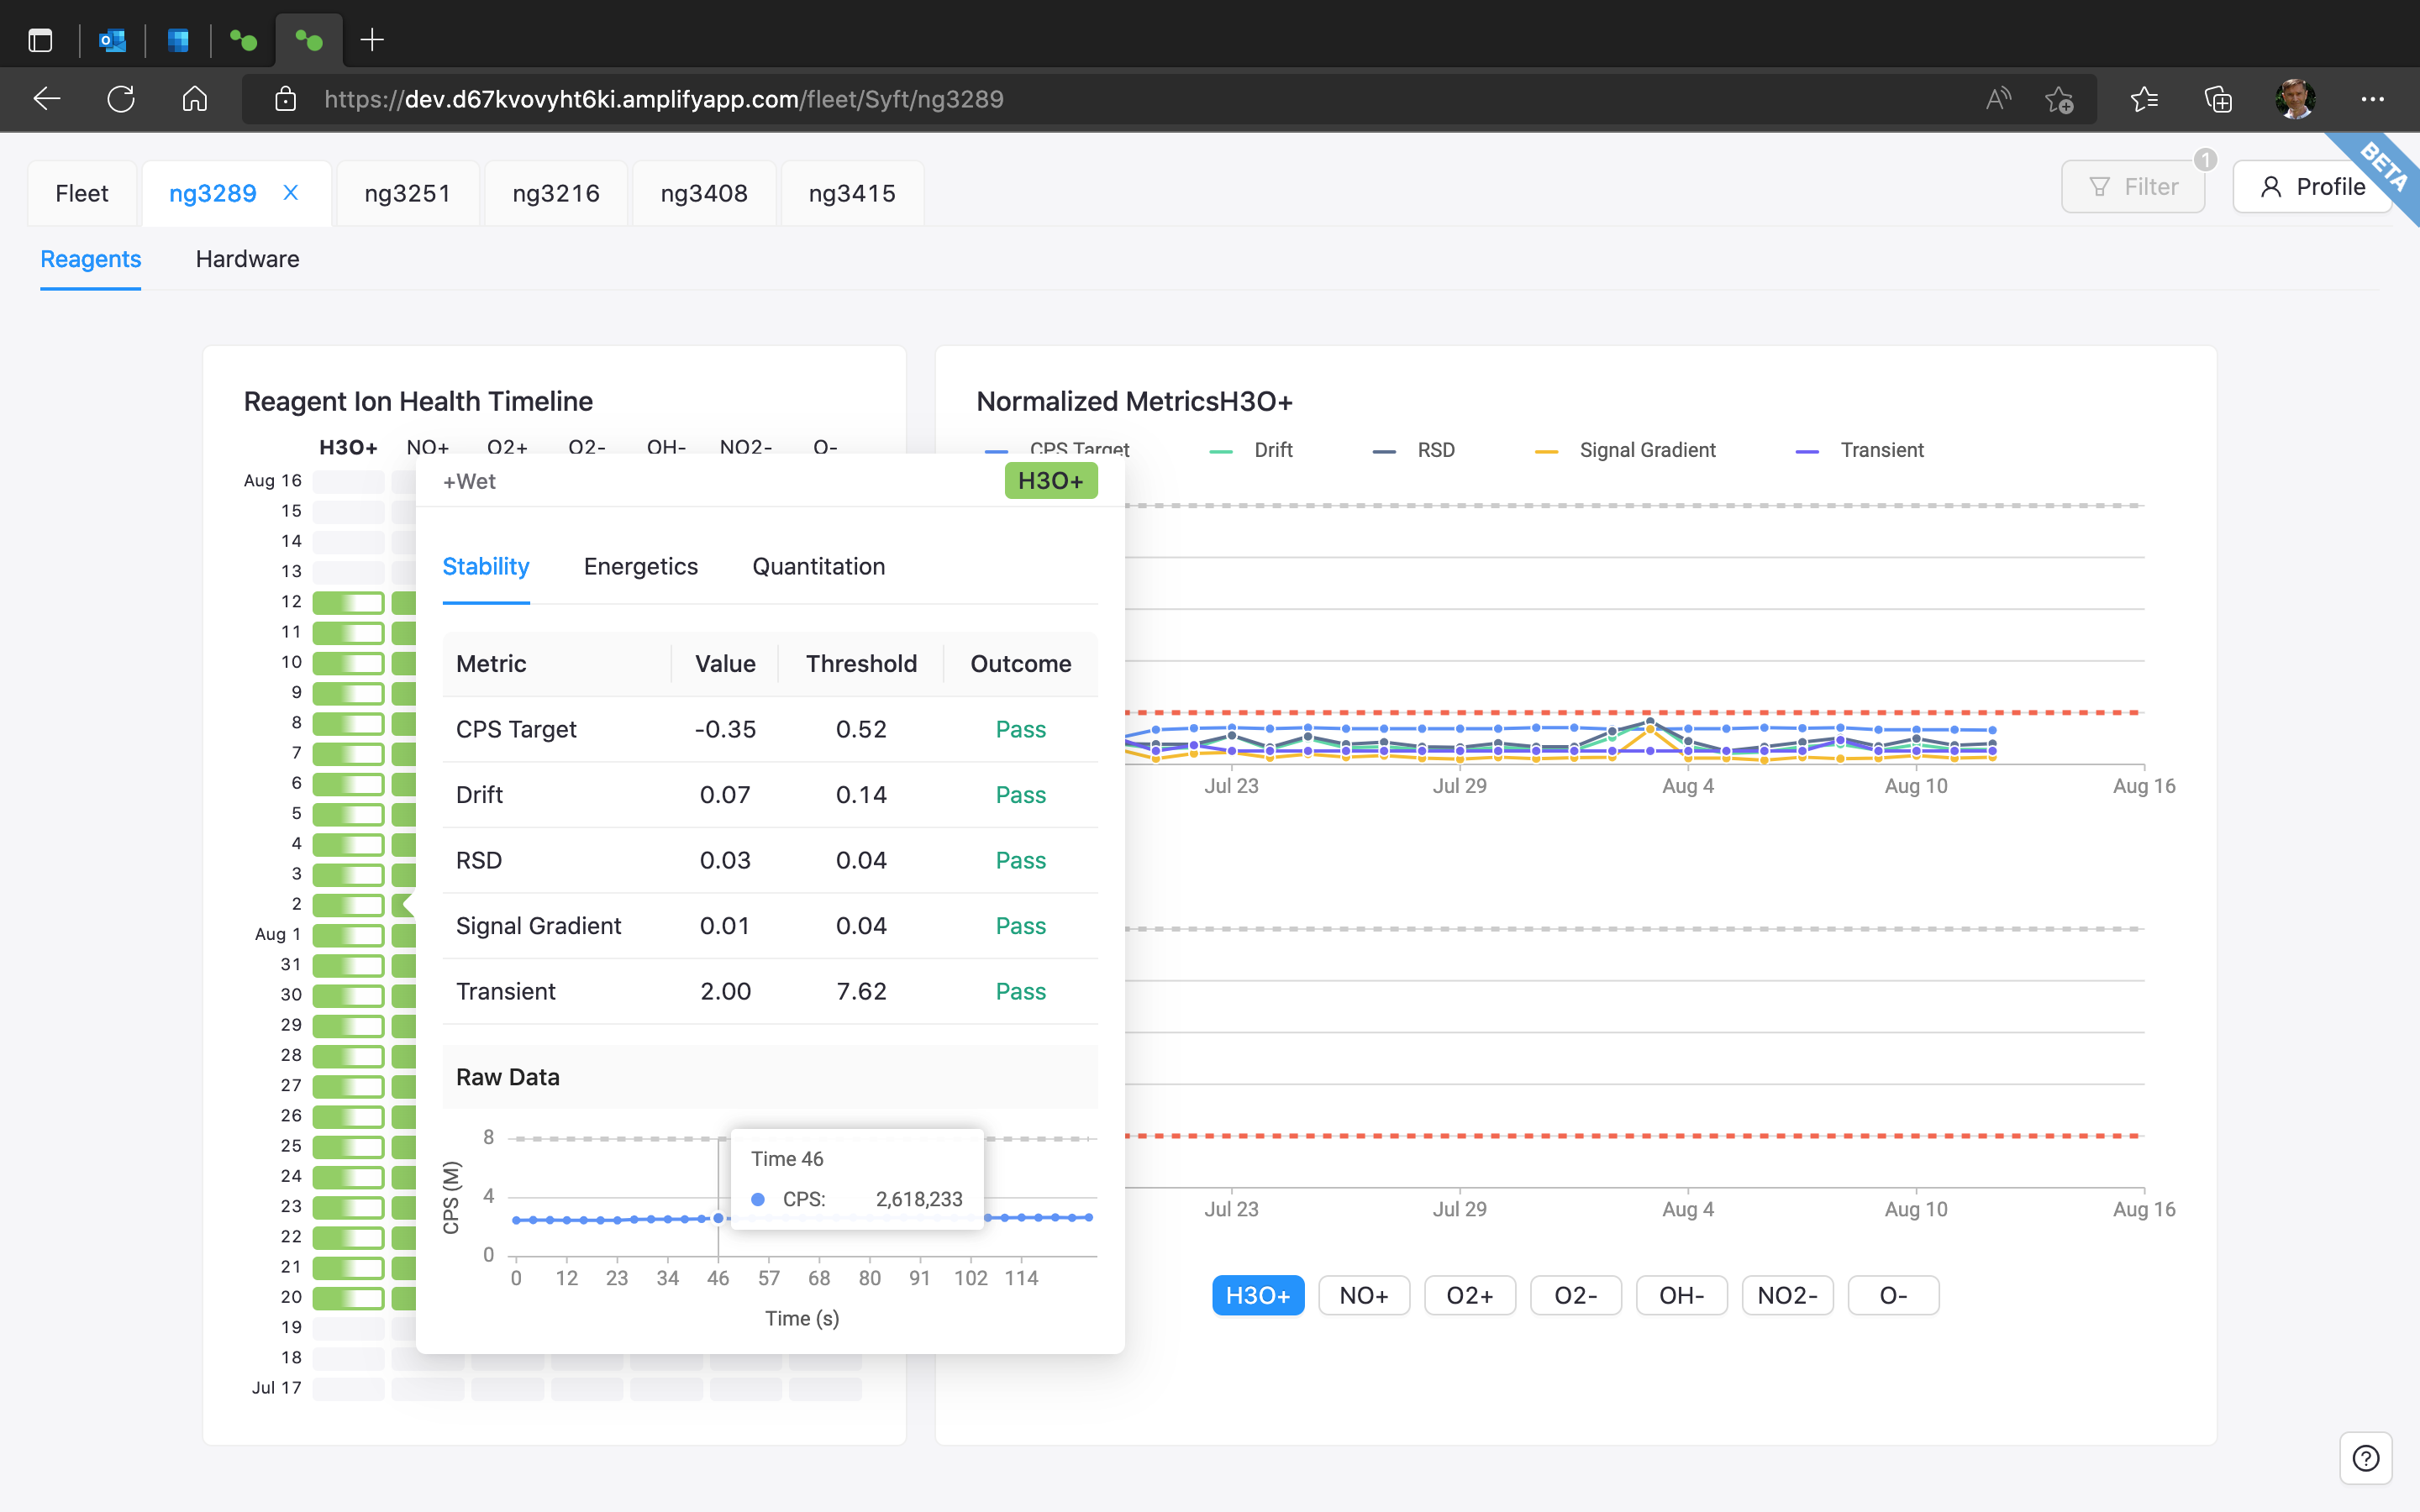
Instrument Details — Selecting an instrument from the fleet view opens a new instrument tab with performance timeline, detail for timeline segment, and hardware information.
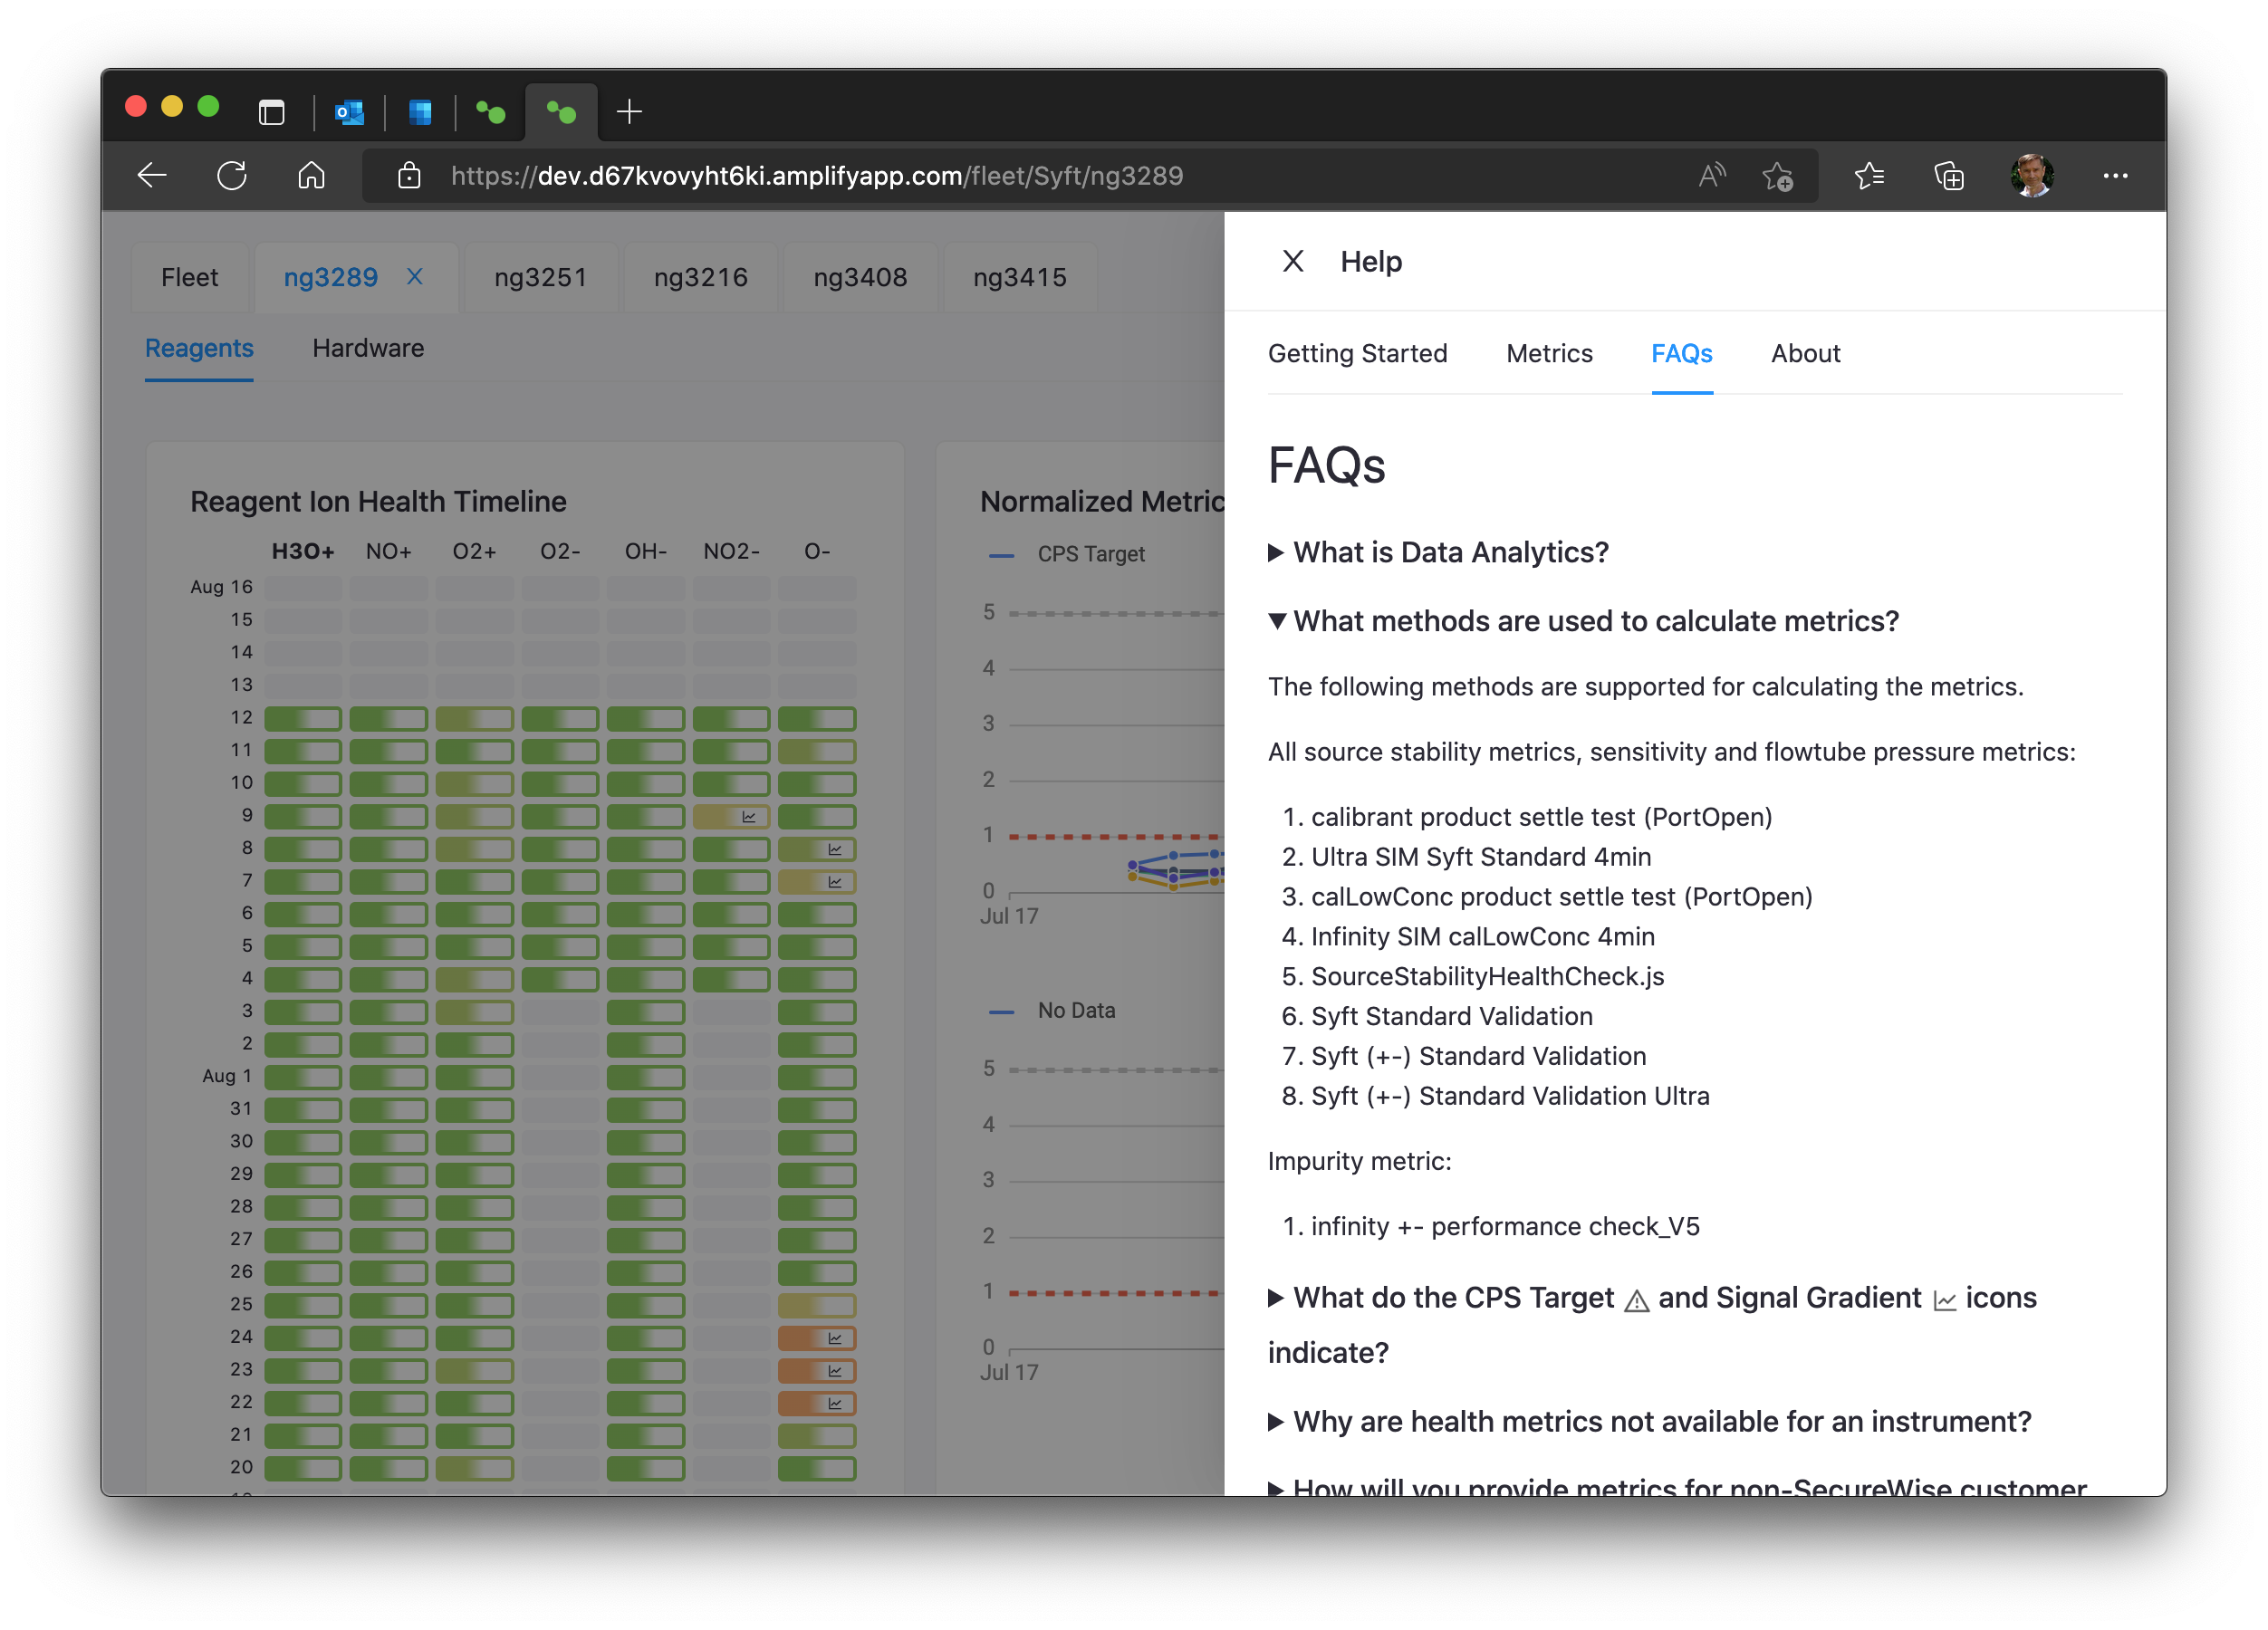
Help Panel — Help information easily updated and tailed for specific customers, fleets and types of instrument.
Mersen R-TOOLS: Complex Engineering Simulation UX
The Problem: Heat sink design required running expensive thermal simulations that took minutes. Engineers needed an interface that made complex thermal engineering accessible while handling long-running compute workloads gracefully.
What I Built: Design and simulation tool that made thermal engineering approachable. Visual layout tools for heat sources and cooling systems, with async simulation handling that didn't block user workflow.
Core Capabilities:
- Visual design interface for complex thermal layouts
- Async simulation execution (minutes-long compute)
- Heat sink recommendation engine based on thermal requirements
- Non-blocking UX that allows parallel design work
Stack: React, Recoil, AntD, AWS (Lambda, EC2 simulation servers)
R-TOOLS MAXX Air and Liquid Cooled Heat Sink Selector Tool
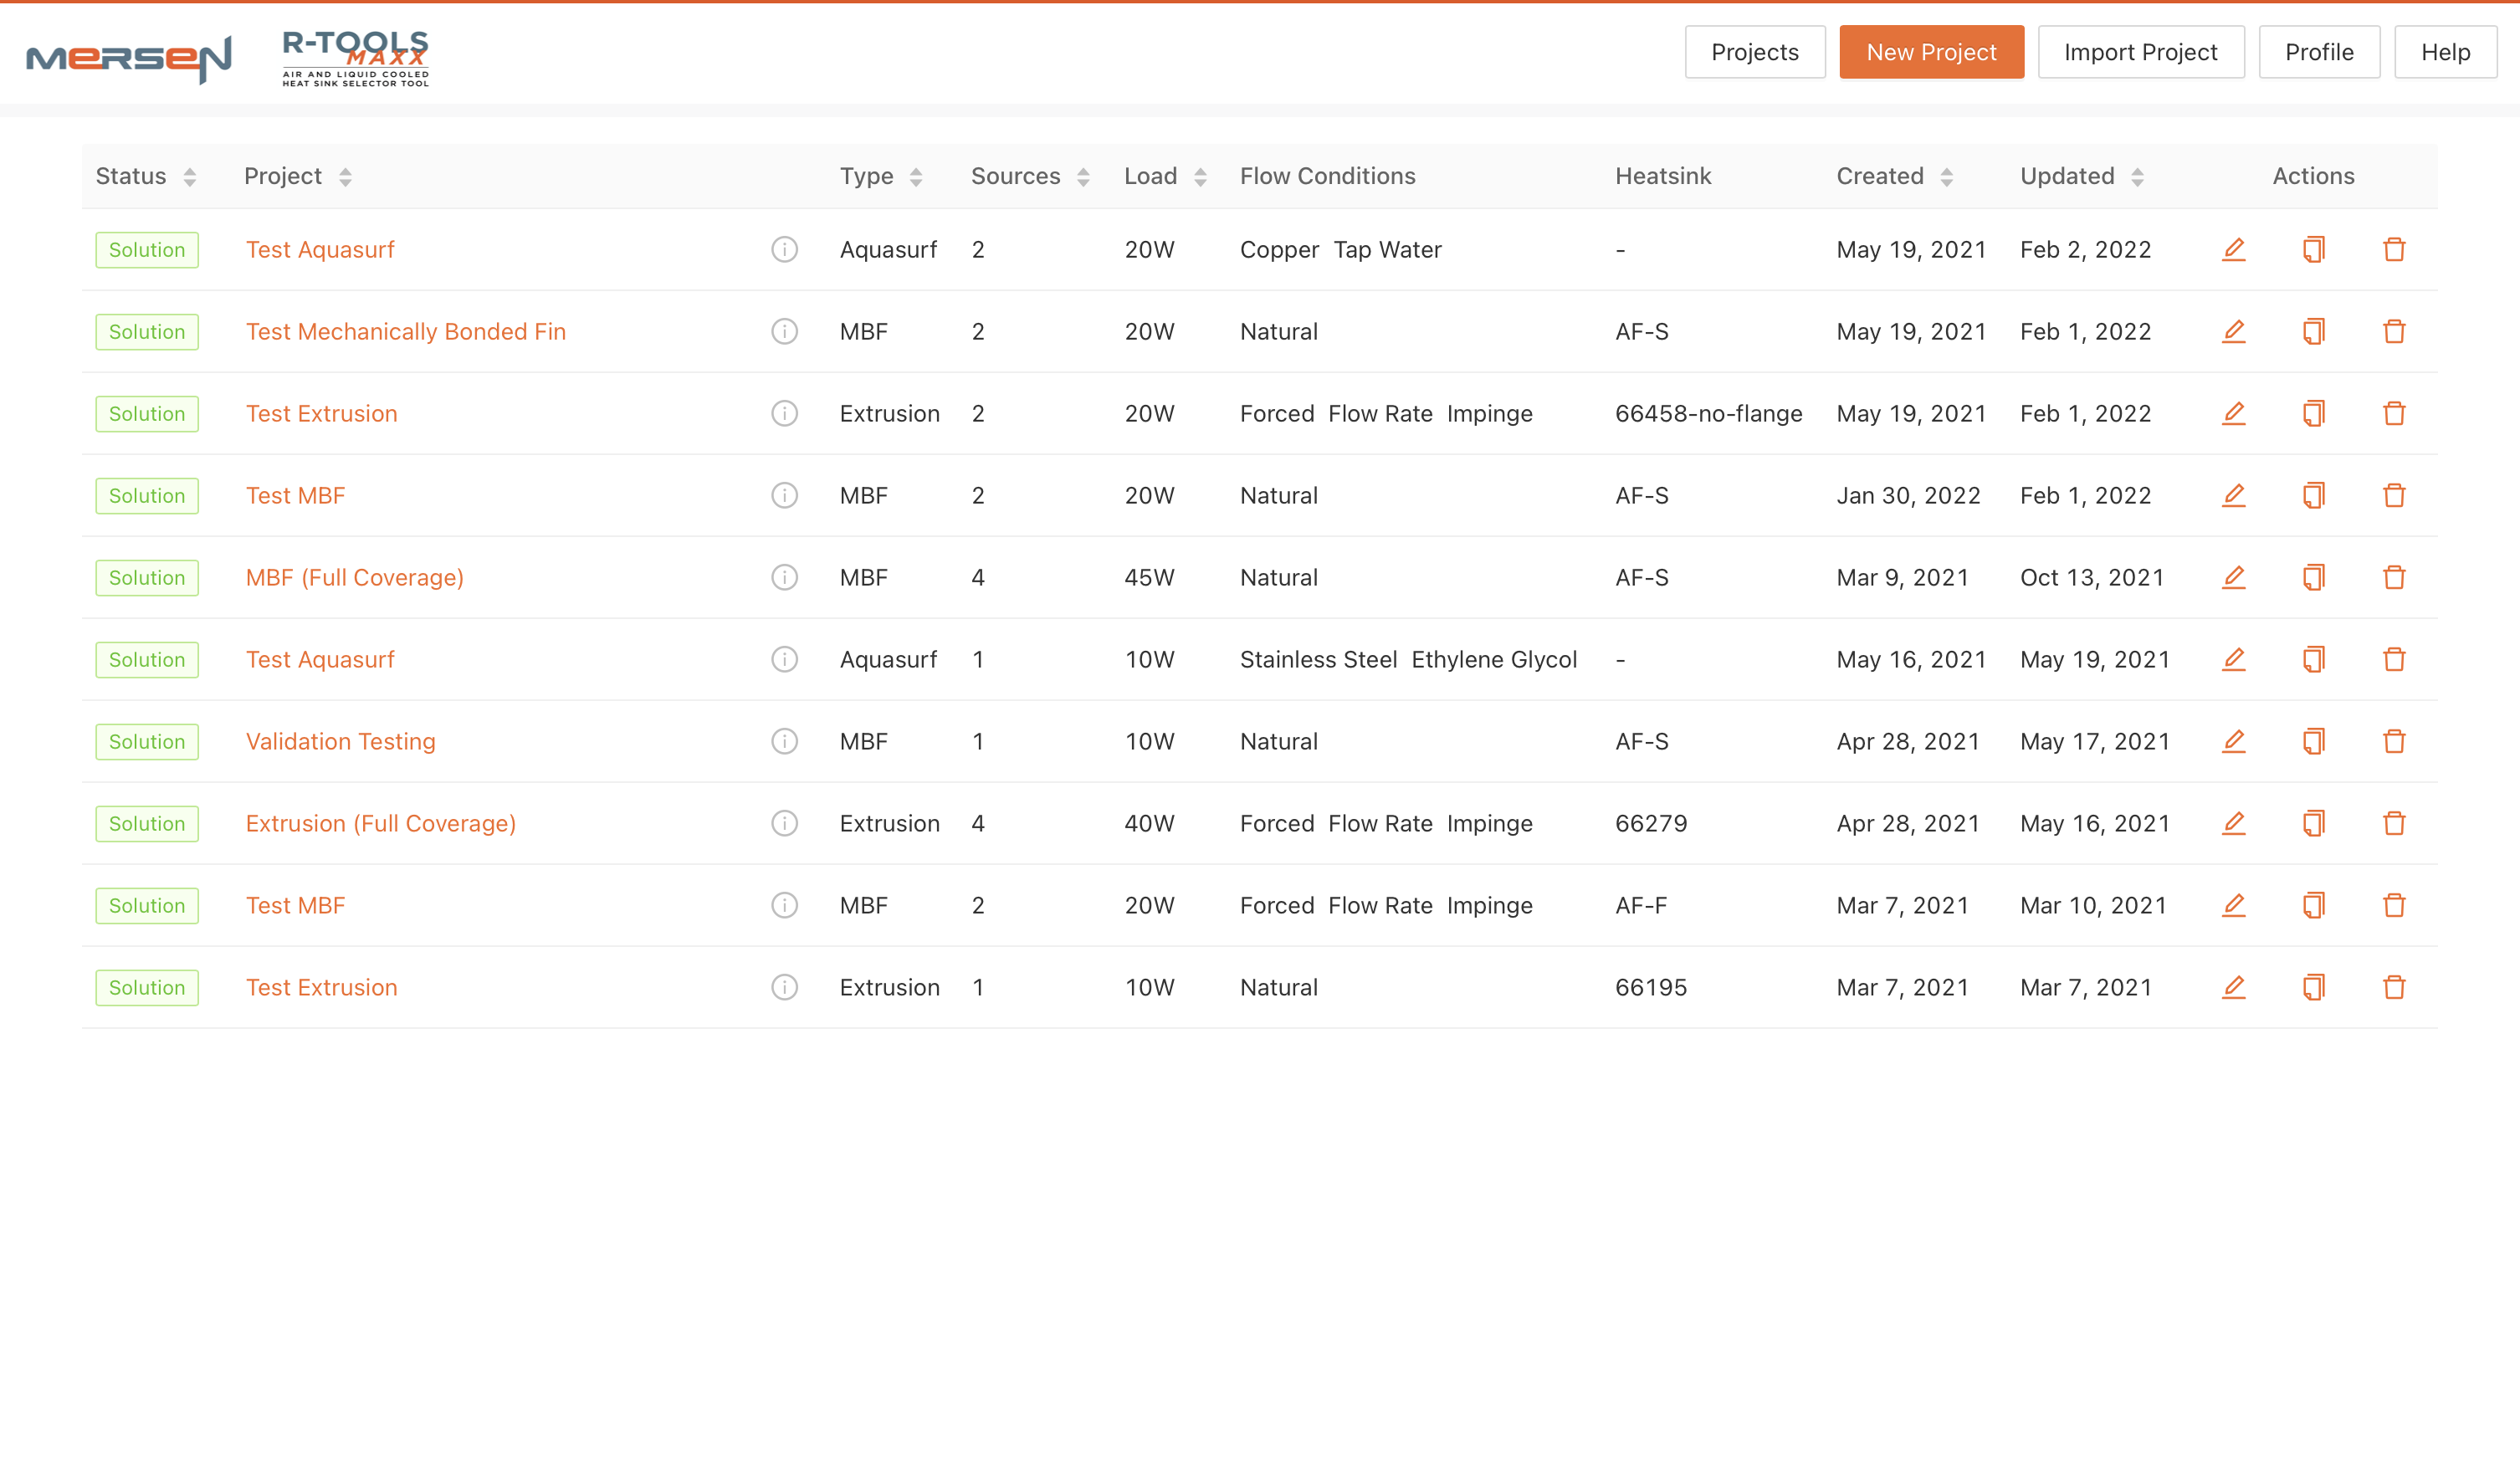
Projects List — List of all the user's designs and summary of key parameters
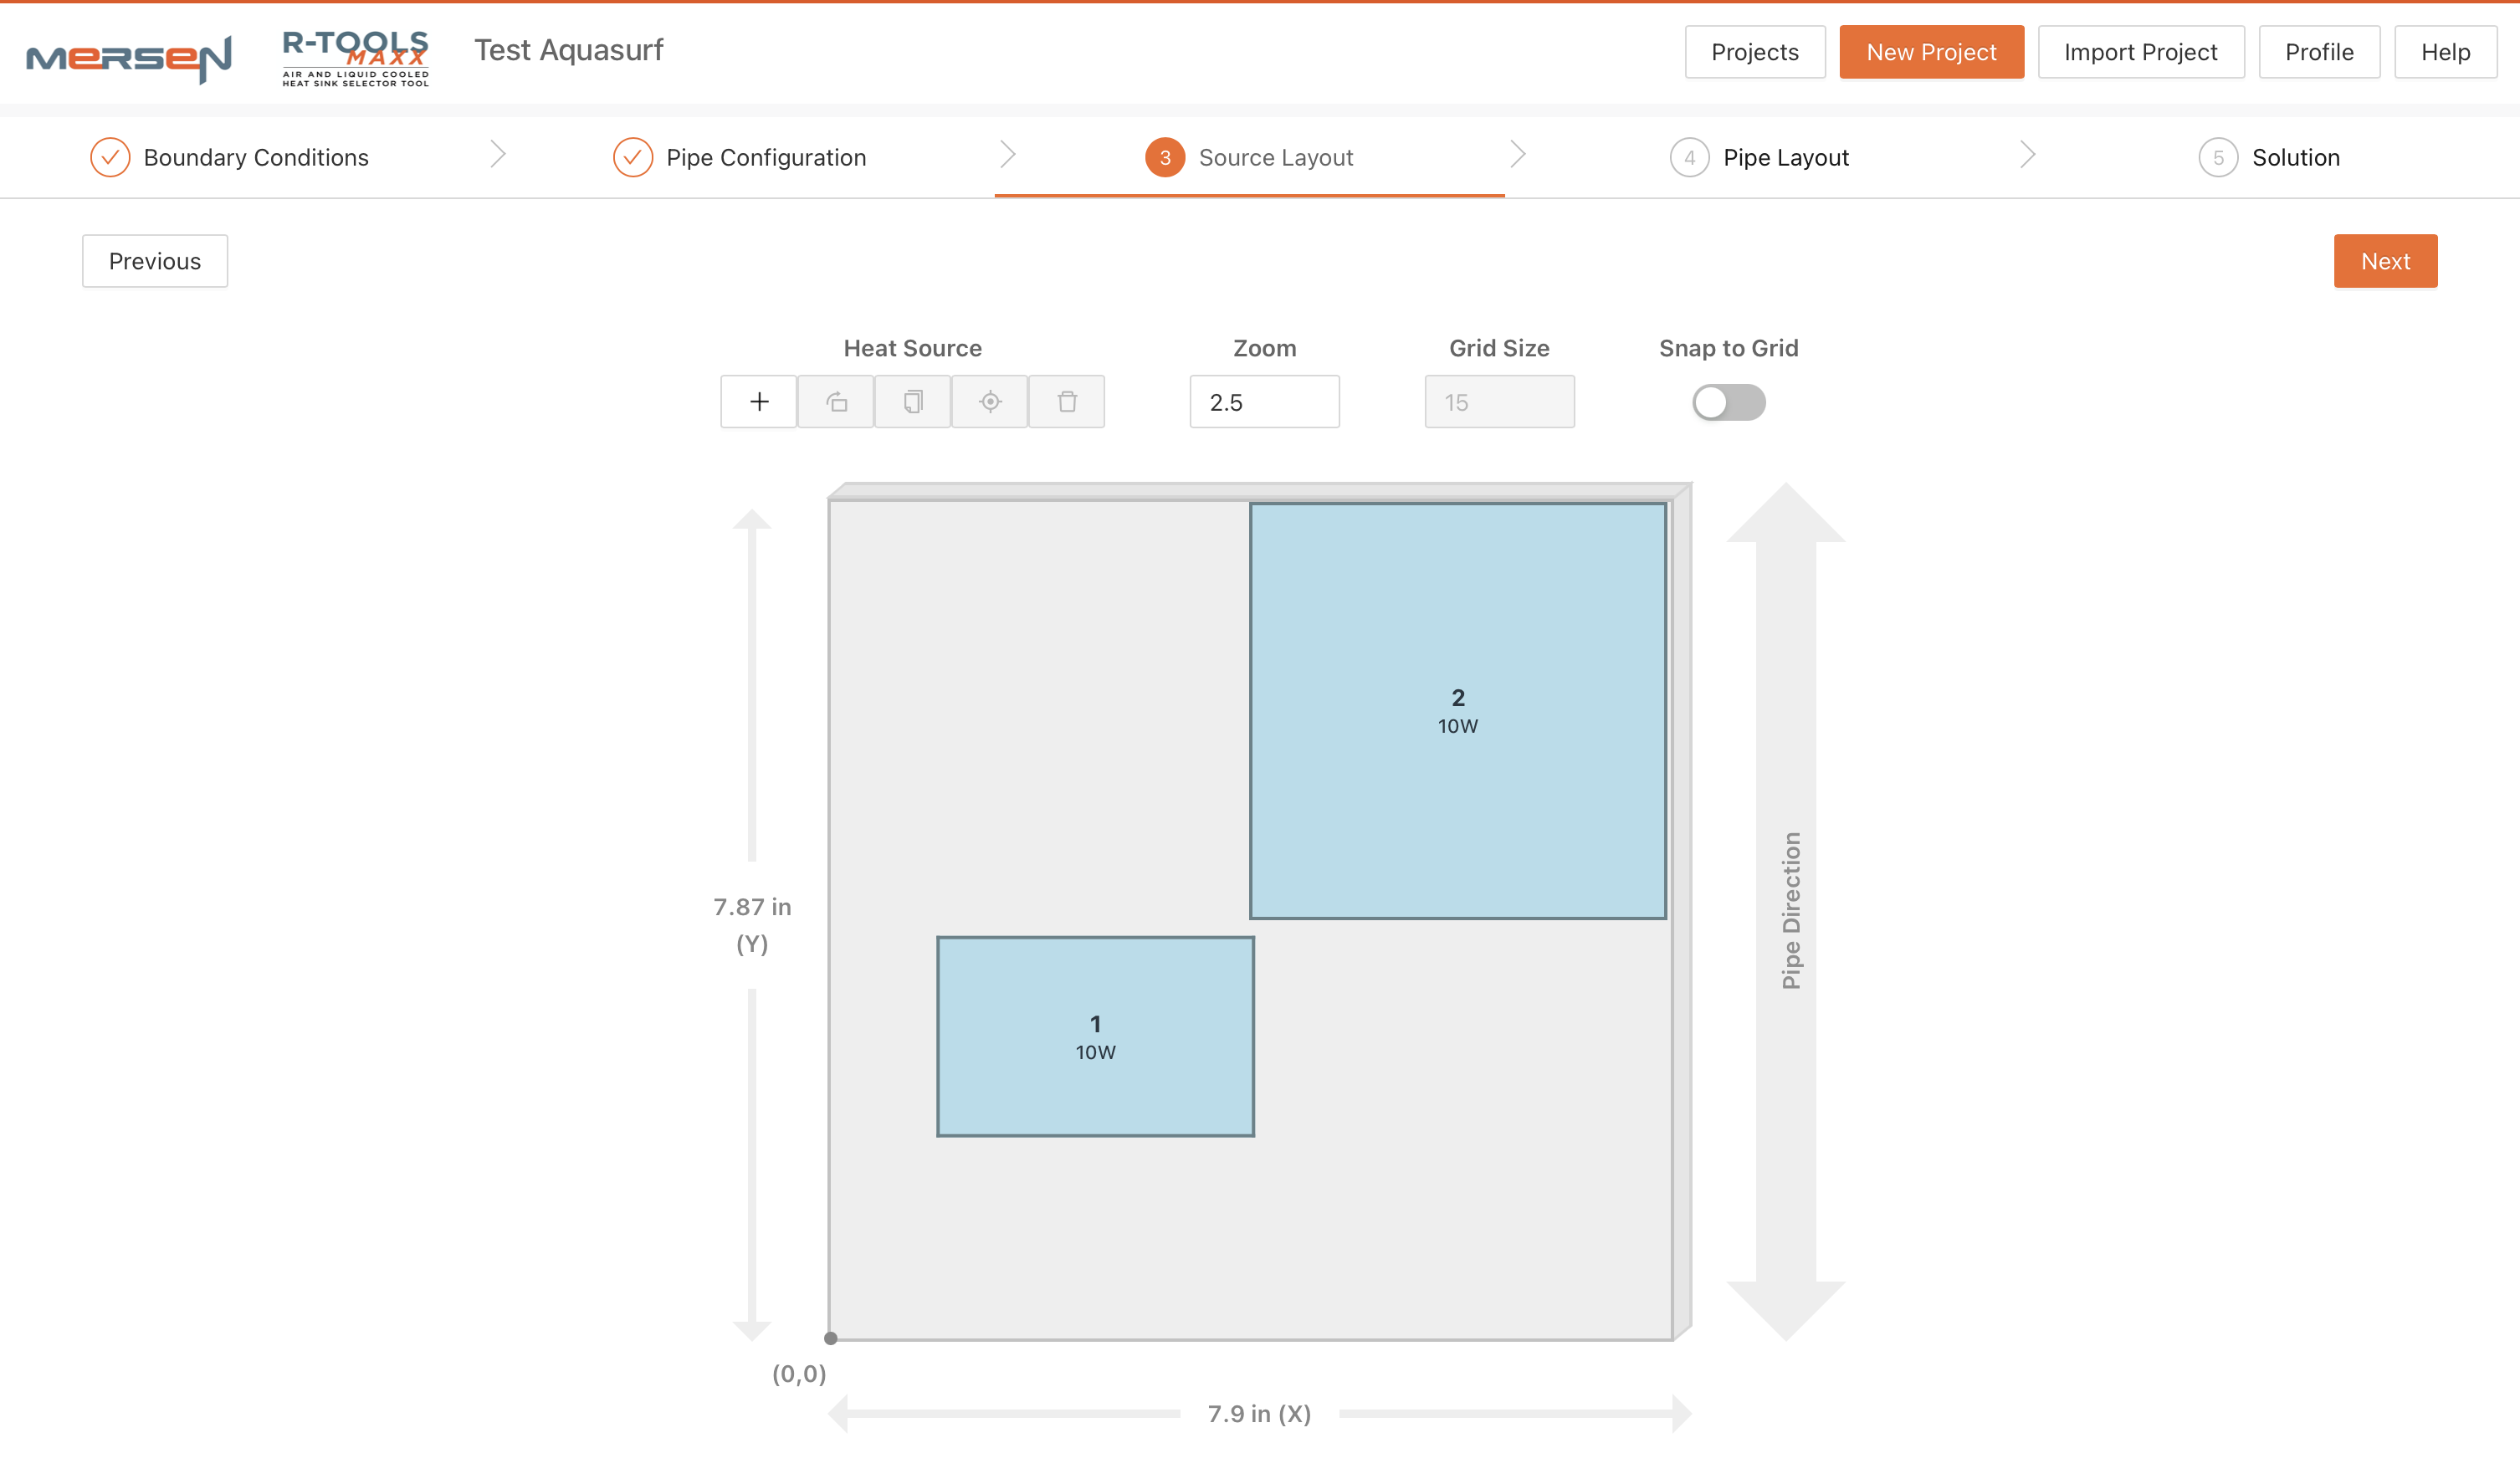
Heat Source Layout — Specify the size and parameters of heat sources, add and remove heat sources, drag to position.
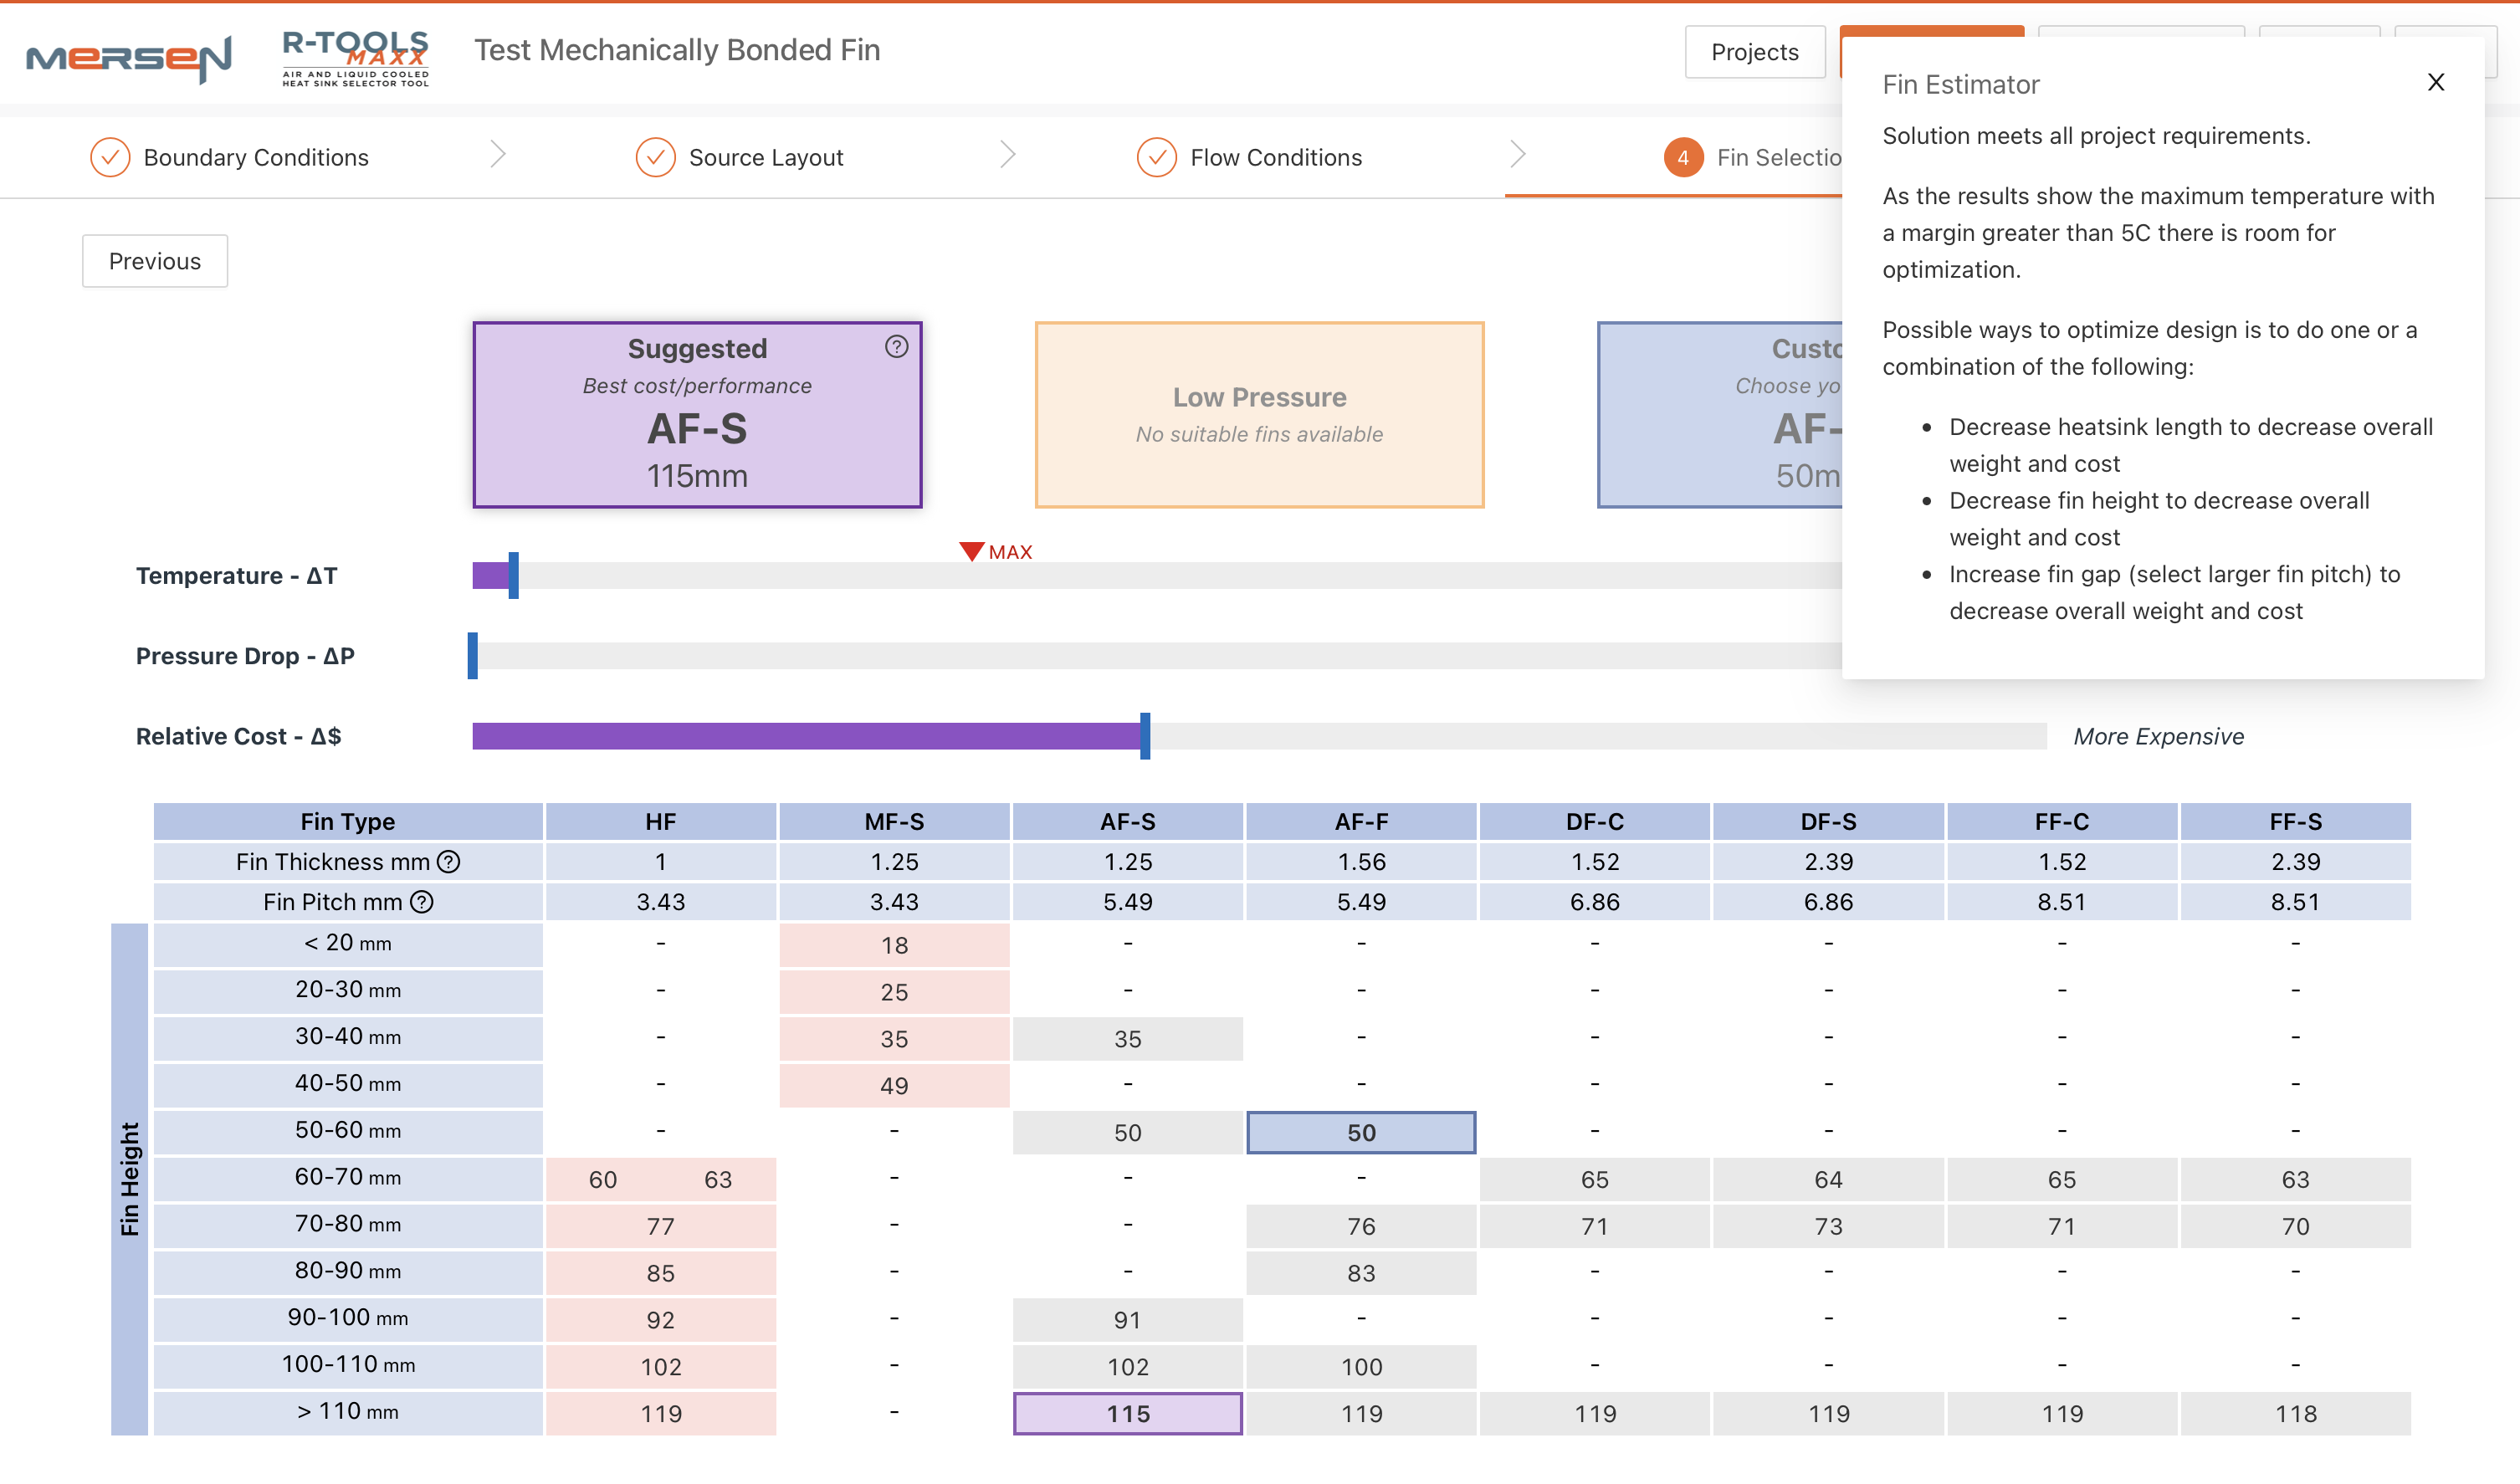
Mechanically Bonded Fin Selector — The fin selector recommends suitable heat sink extrusions from the specified the heat sources and flow conditions.
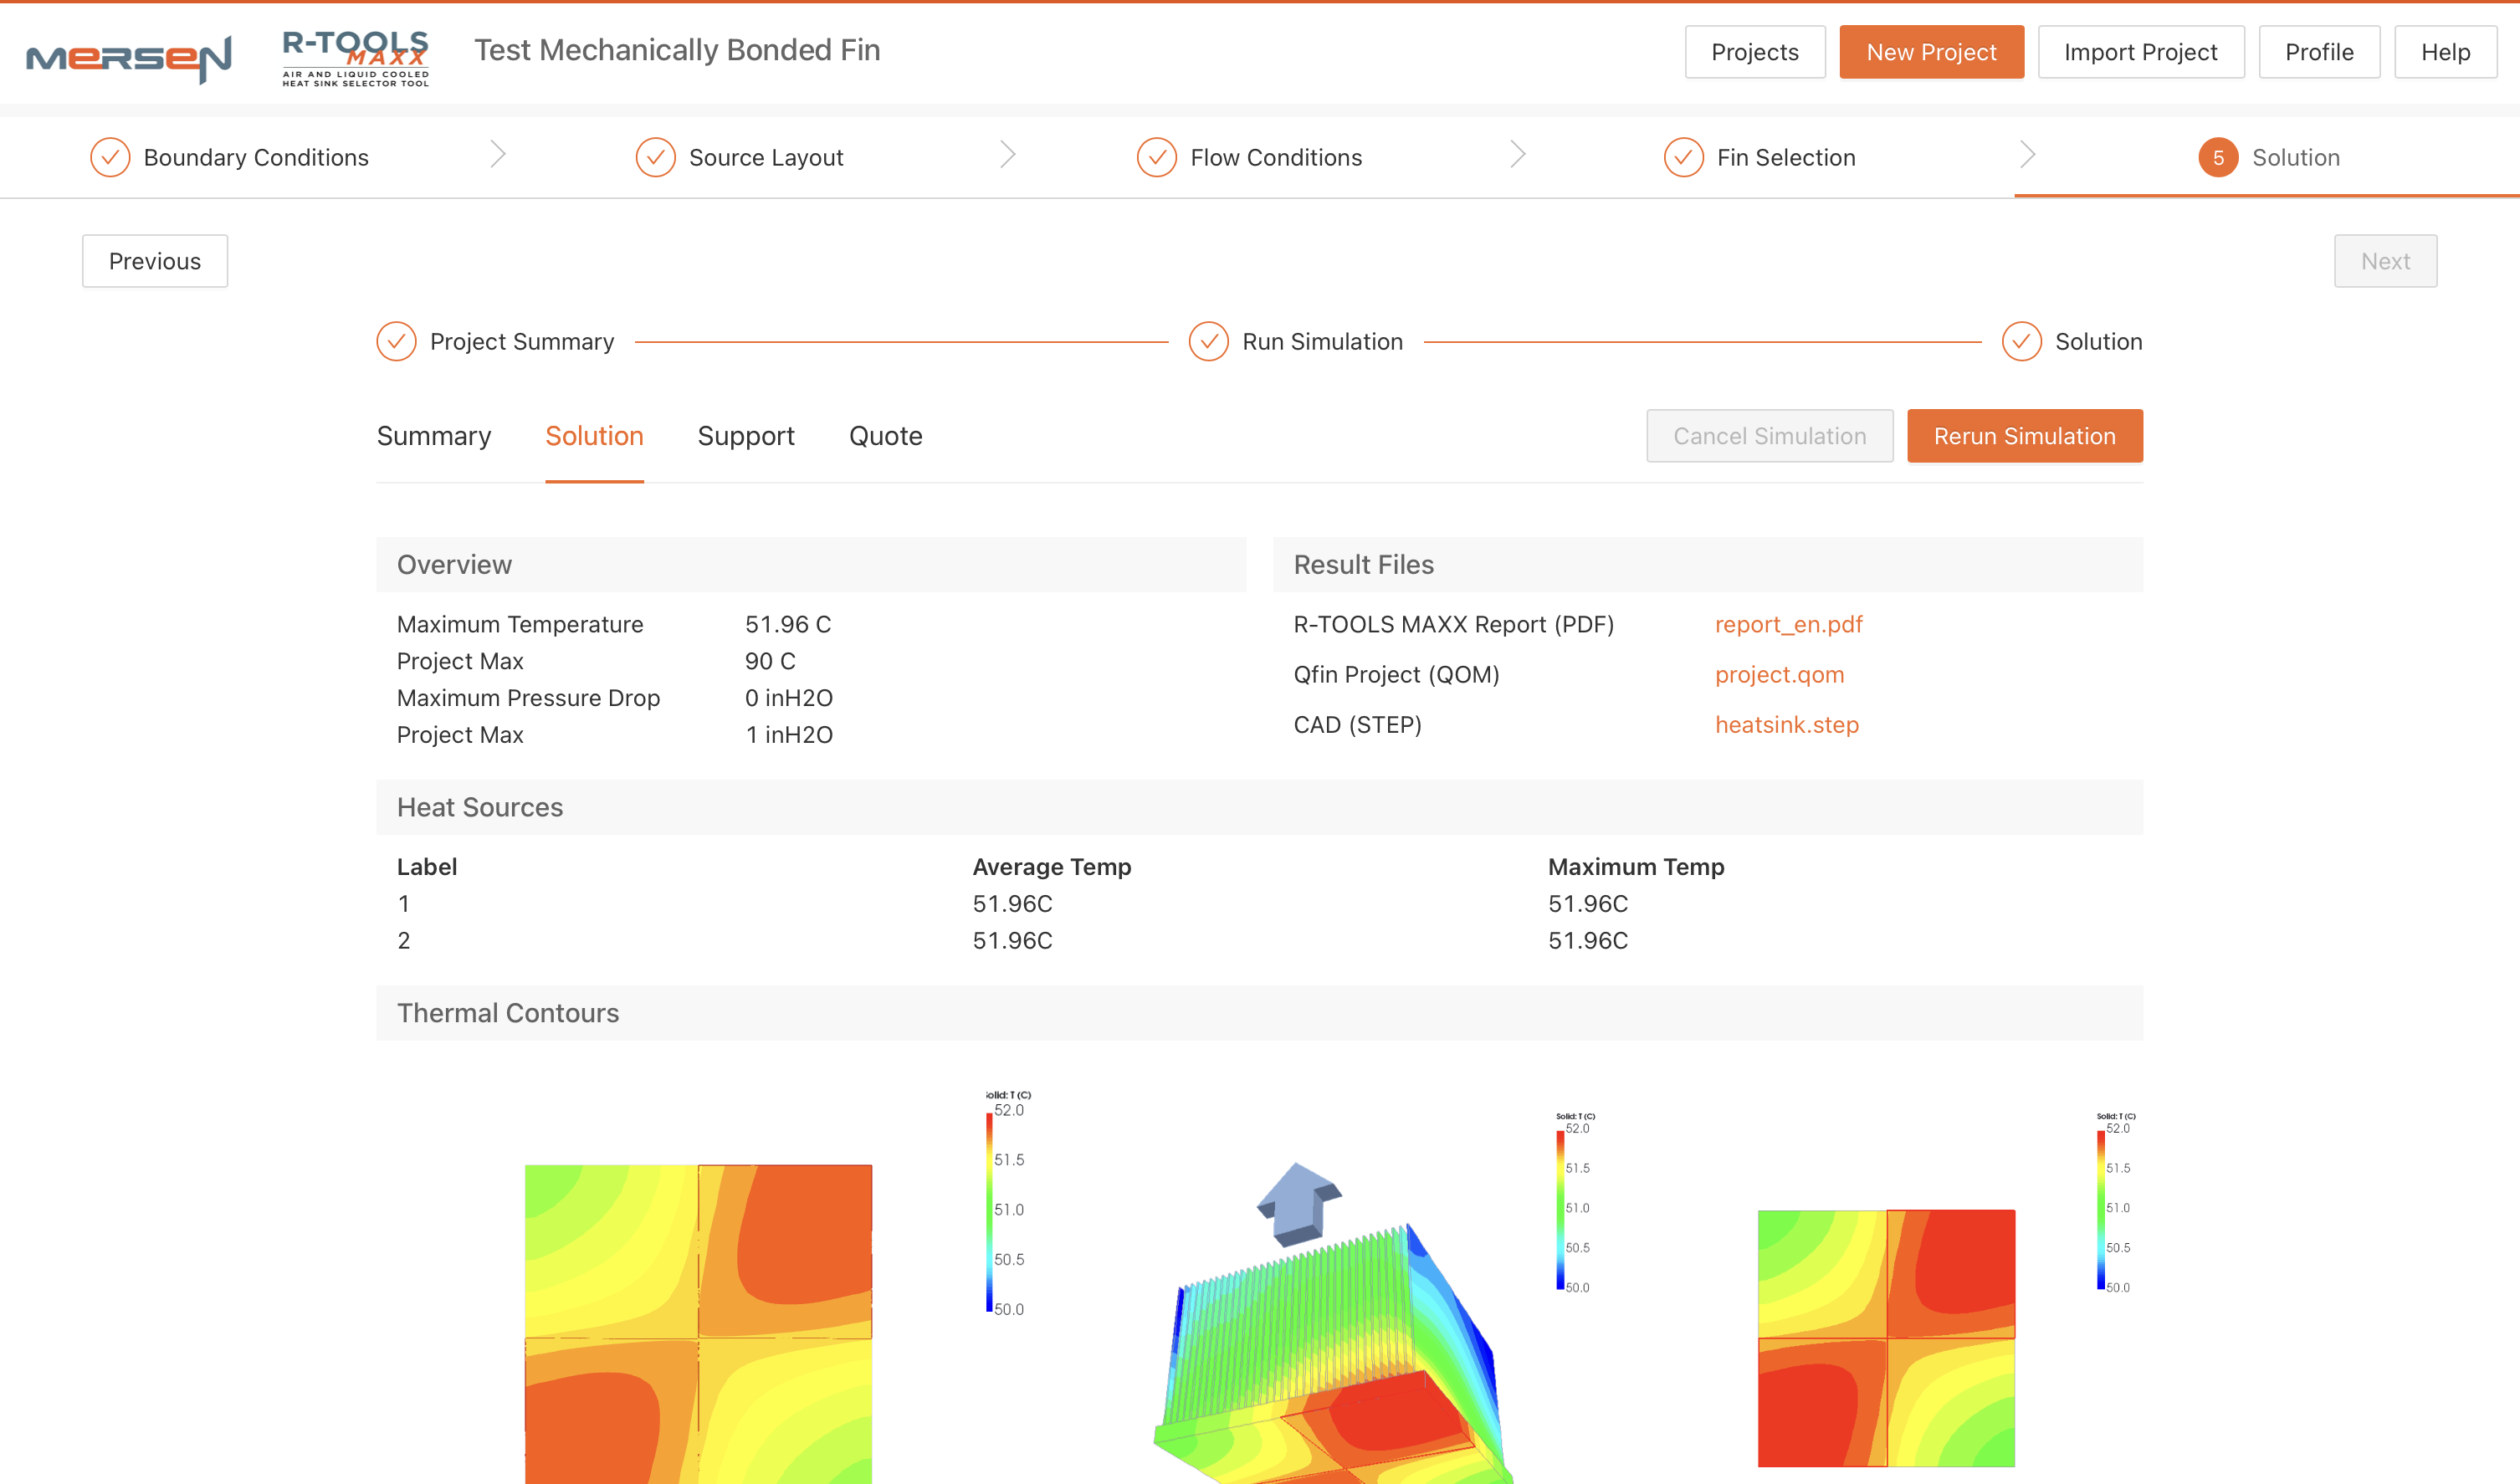
Mechanically Bonded Fin Thermal Simulation — Simulations run on separate EC2 servers and depending on the design complexity may take minutes to complete. Users can continue with other designs and come back to review the completed simulation.
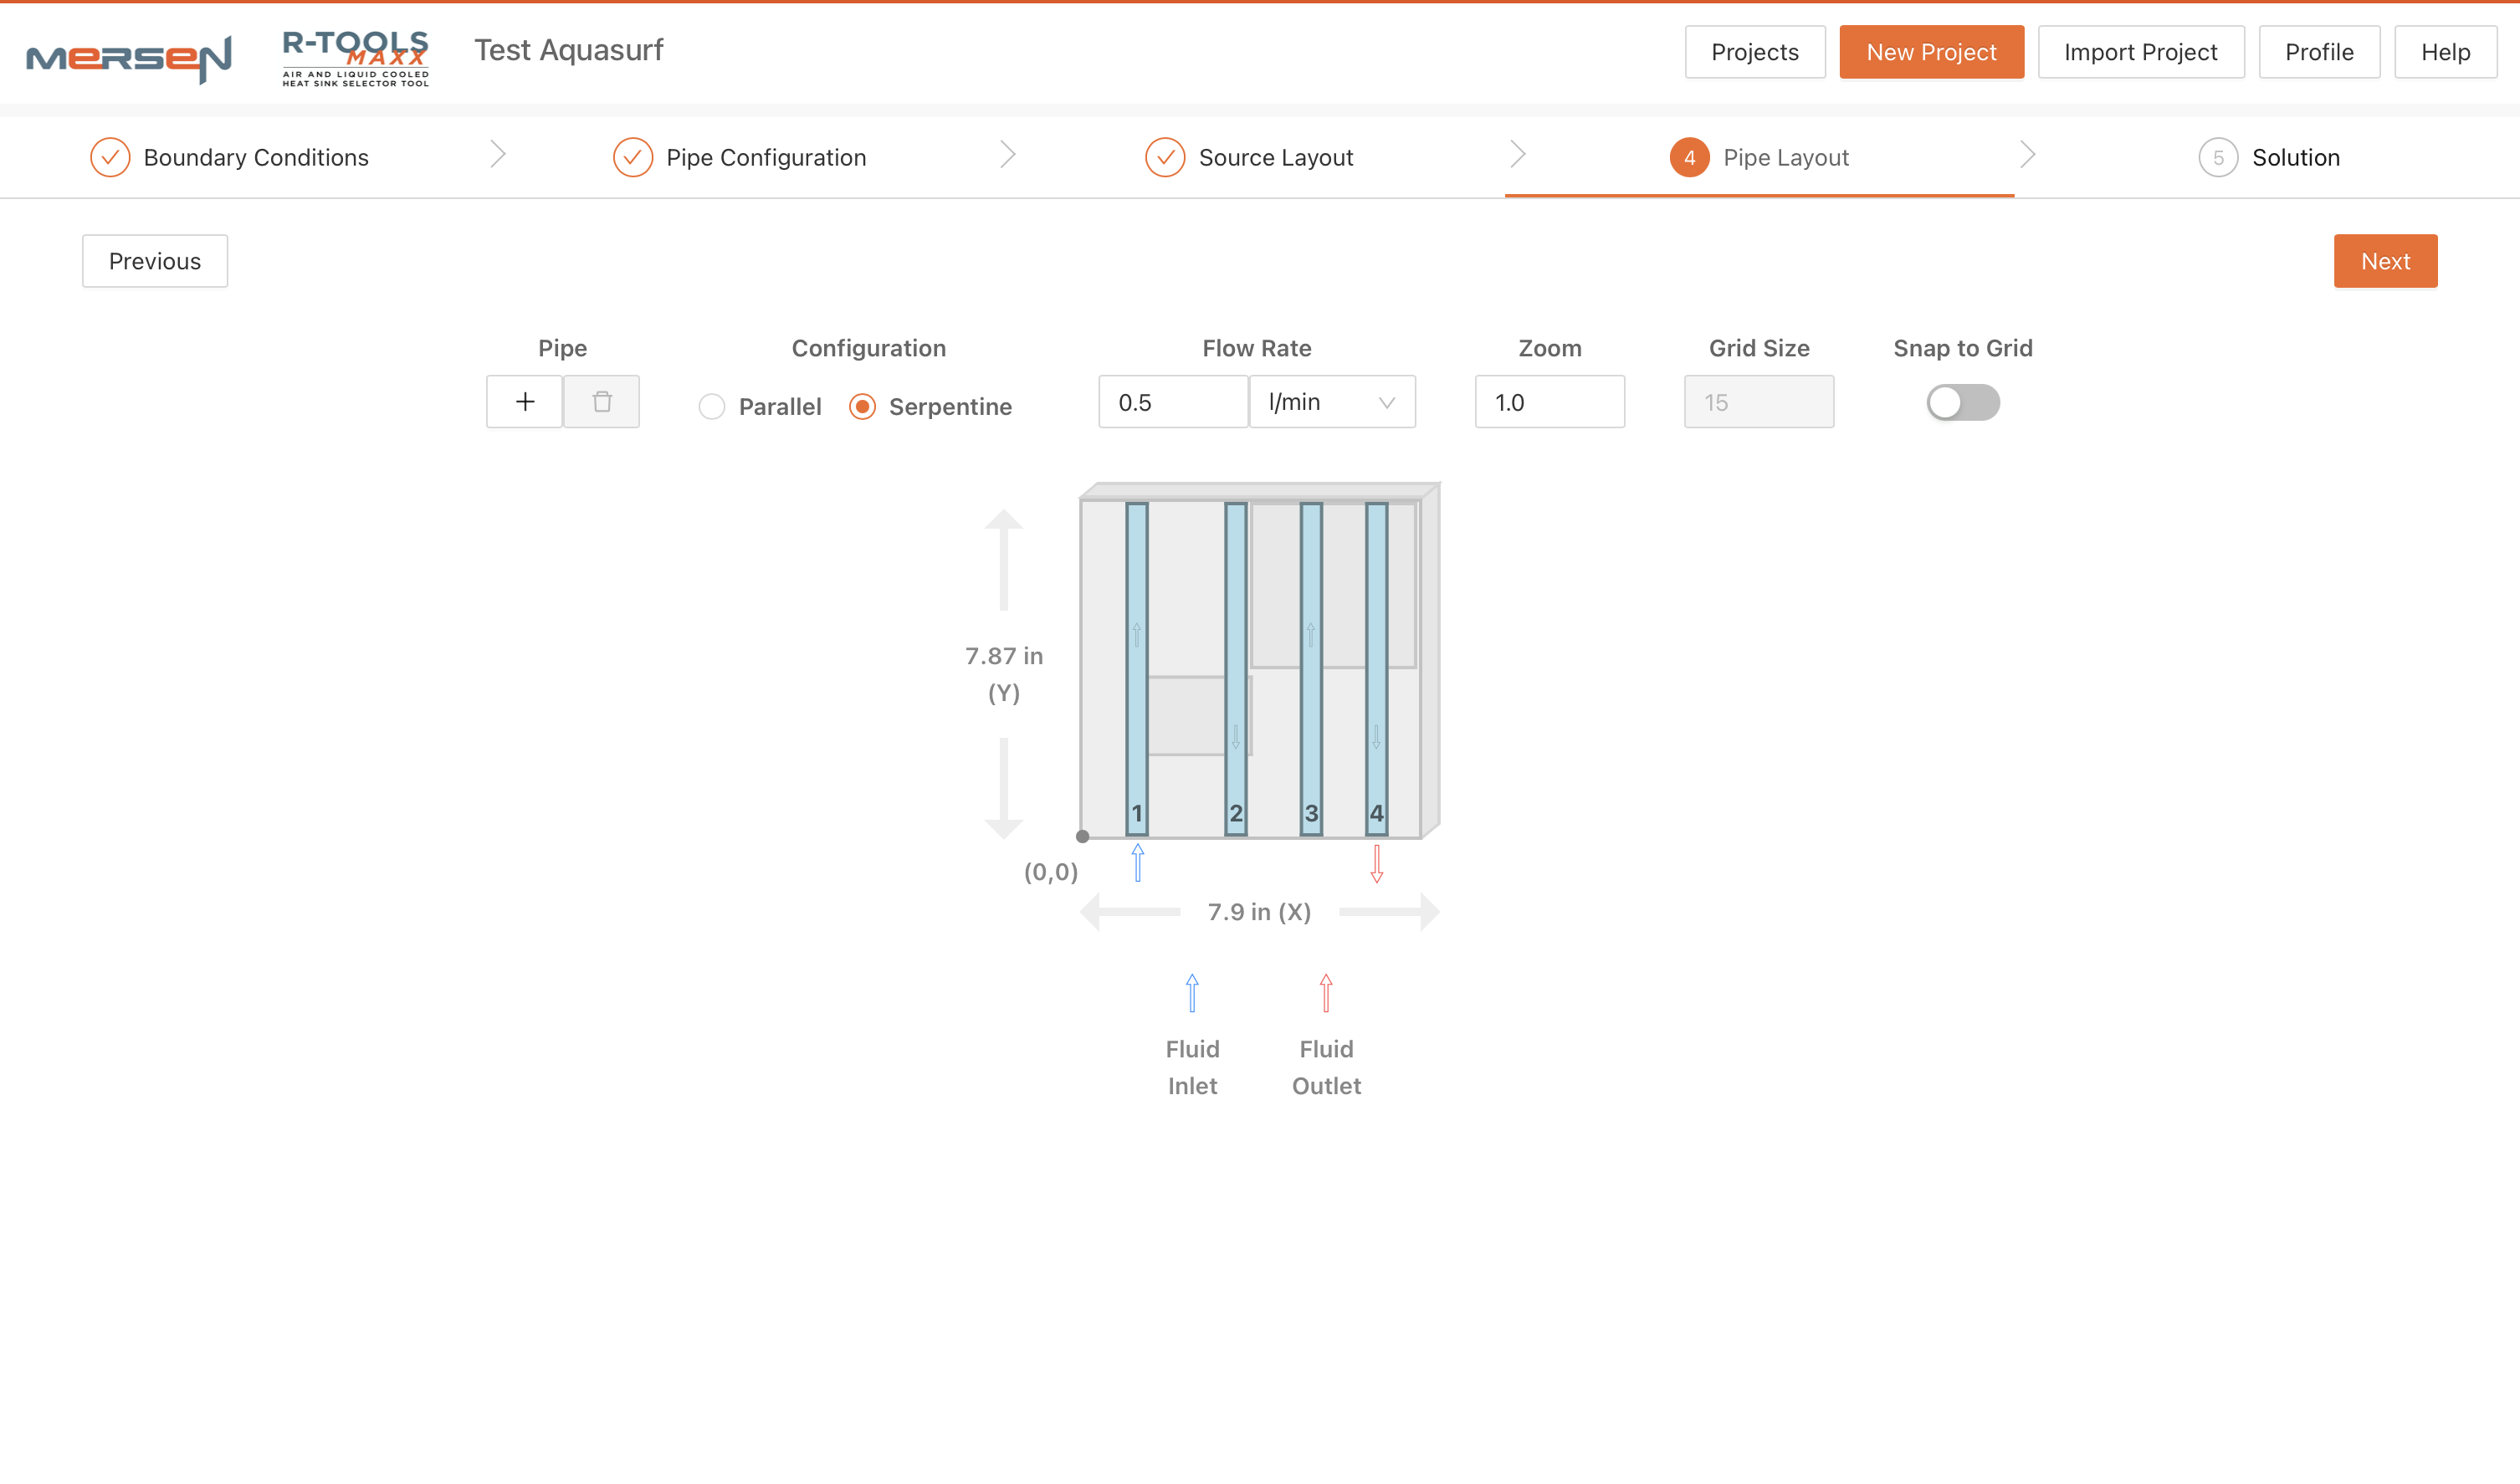
AquaFlow Pipe Layout — AquaFlow heatsinks have embedded coolant pipes in the heat sink base. Users can add and remove pipes, position them and set the flow direction.
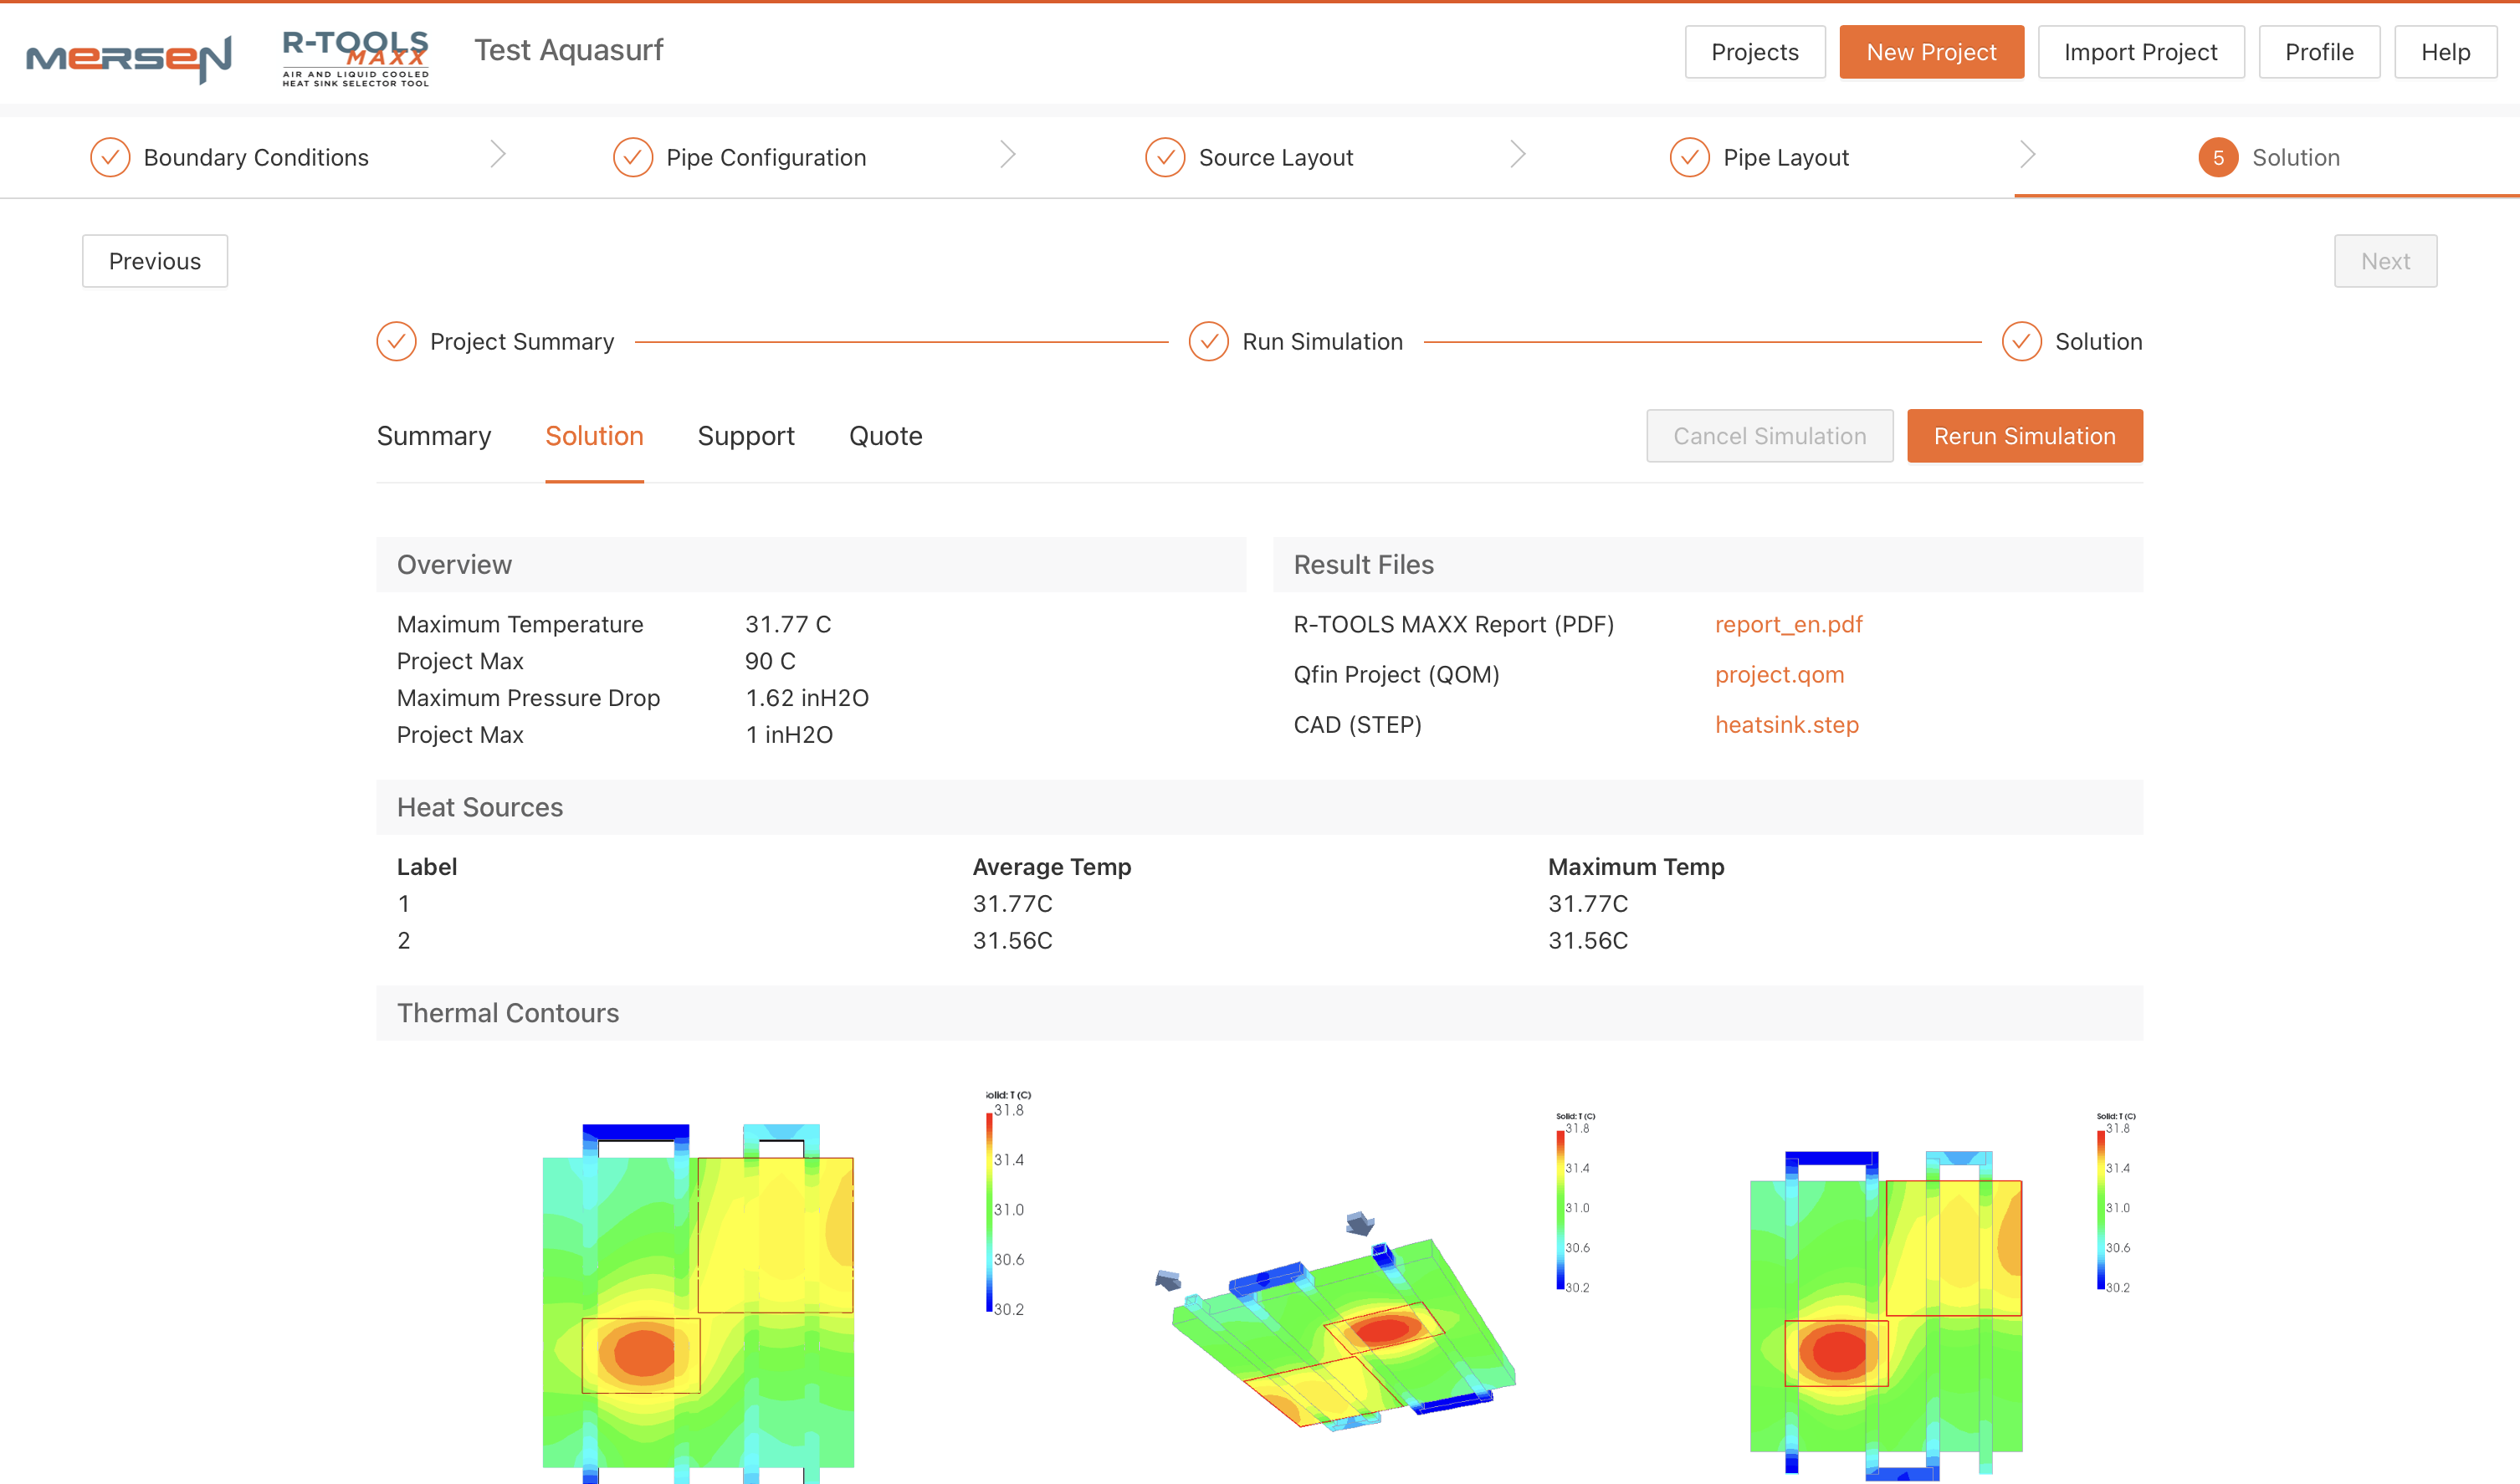
AquaFlow Thermal Simulation — Simulations run on separate EC2 servers and depending on the design complexity may take minutes to complete. Users can continue with other designs and come back to review the completed simulation.
Common Patterns
These projects share core characteristics:
- Complex systems made explorable through custom visualization
- Real-time or async data handled gracefully in the UX
- Technical depth in both frontend engineering and system architecture
- Bespoke solutions for problems off-the-shelf tools couldn't solve
Looking for someone to build something similar for your systems? Get in touch